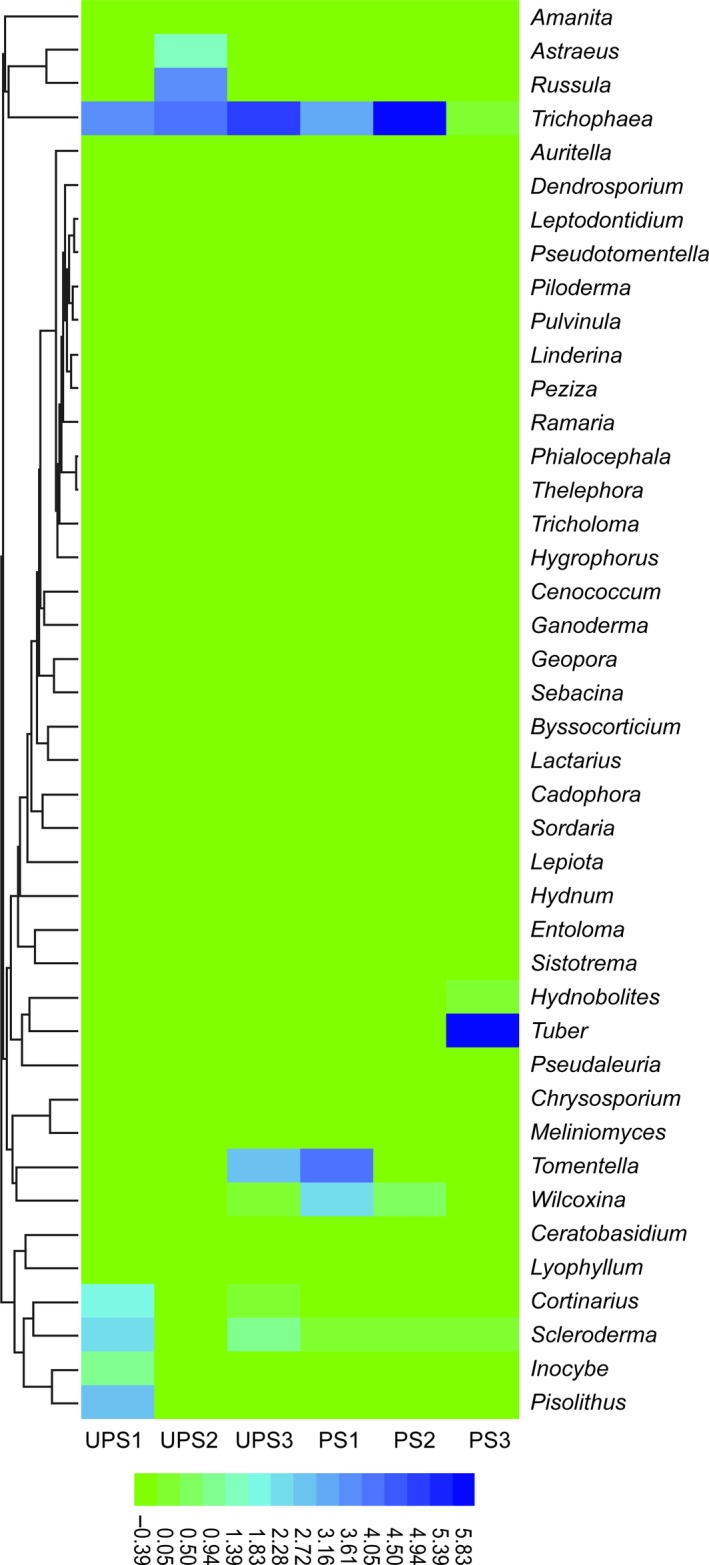
Figure 3.

Heatmap of the Ectomycorrhizal (ECM) fungal community structure of all sites at genus level. The highest and lowest abundance of genera are clustered, respectively: the color gradient and similarity reflect the similarity and dissimilarity of ECM fungal community structure in polluted and unpolluted sites. The horizontal axis shows sample information and the vertical axis shows information pertaining to species annotation
