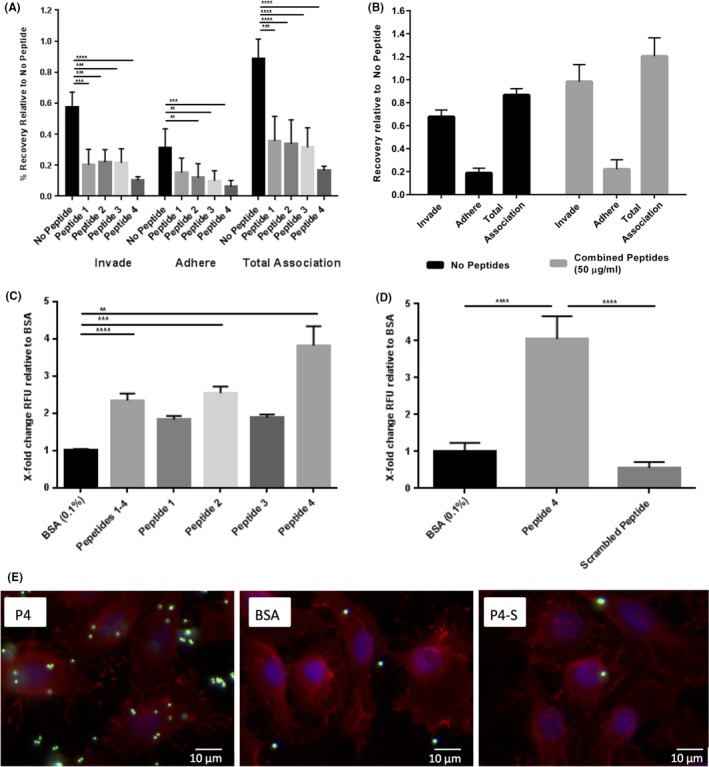
Figure 5.

OmpA2 extracellular loops display direct binding to oral epithelial cells. Antibiotic protection assays were carried out with wild‐type P. gingivalis in the presence of each extracellular loop individually at 50 μg ml−1 (A), or at 50 μg ml−1 total concentration for all four loops (B). (C) Extracellular loop peptides were bound to NeutrAvidin®‐green fluorescent microspheres at 50 μg ml−1 and incubated with a monolayer of OK‐F6 cells and the total fluorescence at 488 nm/515 nm (ex/em) recorded as a measure of the quantity of extracellular loop peptides bound to cells, relative to BSA‐coated microspheres. (D) A scrambled peptide was used as a control. (E) Immunofluorescence images of peptide 4‐bound microspheres (P4) incubated with OK‐F6 monolayers and imaged at ×100 magnification, BSA‐coated microspheres (BSA) and scrambled‐peptide‐bound microspheres (P4‐S). NeutrAvidin®‐green microspheres are visualised in the Green channel (488 nm) with WGA‐Texas Red® (red, 549 nm) highlighting cell membranes and DAPI (blue) for cell nuclei. Statistical significance was determined by students’ t‐test and designated as **p < .01, ***p < .001. **** p < .0001. Error bars ± SEM. Scale bars are 10 μm. BSA, bovine serum albumin
