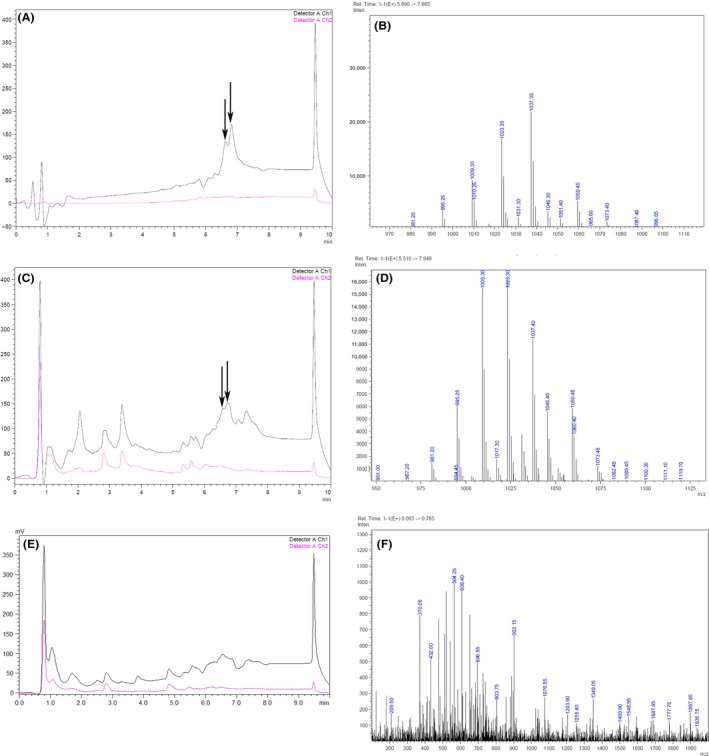
Figure 6.

HPLC‐MS spectrograms of standard surfactin and surfactin produced by the wild strain and LL3Δsrf. (A, B) HPLC and MS spectrograms of standard surfactin. (C, D) HPLC and MS spectrograms of surfactin from the wild strain. (E, F) HPLC and MS spectrograms of the LL3Δsrf culture broth, which was disrupted in srf cluster and deficient in production of surfactin
