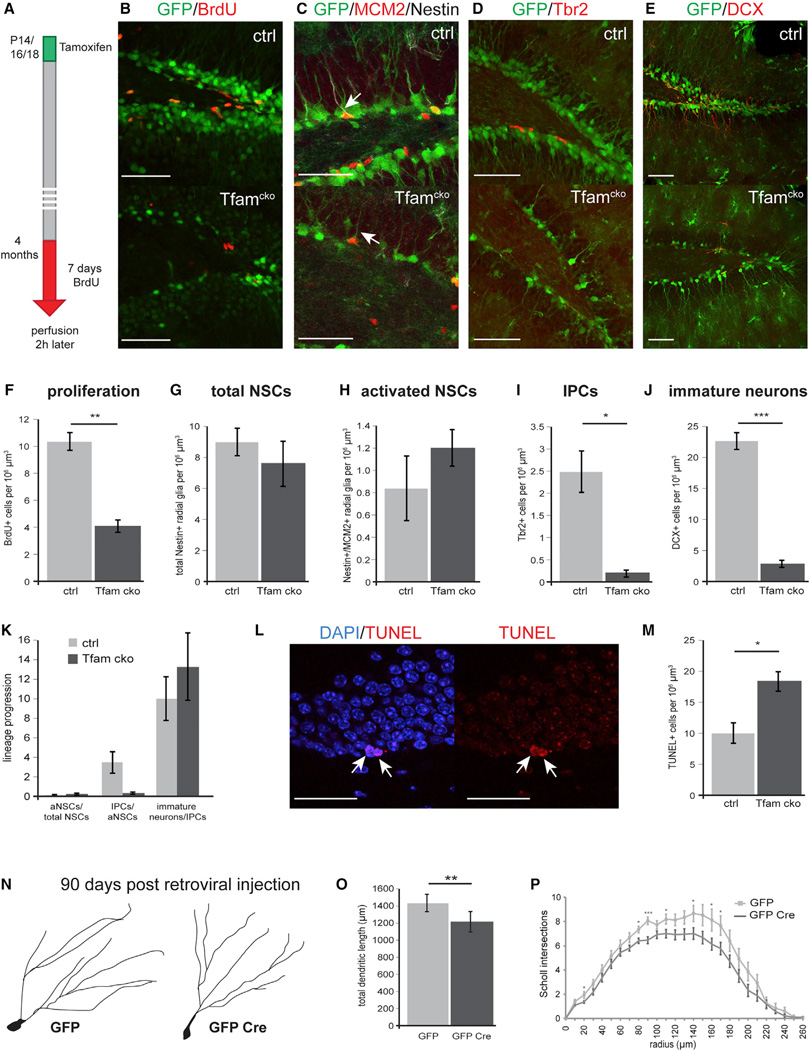
Figure 3. Tfam Deficiency Does Not Affect NSCs but Impairs Neurogenesis at the Level of IPCs in 4-Month-Old Mice.
(A) Experimental scheme of BrdU-paradigm used in (B)
(B and F) Confocal images and quantification of control and Tfamcko mice showed a significant reduction in the number BrdU-expressing cells (red). GFP-reporter-positive cells are shown in green.
(C–J) (C and G) Confocal images and quantification of Nestin immunoreactive cells (white) indicated no differences in number of total NCSs between control and Tfamcko mice; (C and H) activation of NSCs was not affected as revealed by quantification of cells co-expressing Nestin and the cell-cycle marker MCM2 (red, arrow). Tbr2+ IPCs (red; D) as well as DCX+ immature neurons (red; E) were significantly reduced in Tfamcko mice (I and J).
(K) Comparison of the lineage progression index between ctrl and Tfamcko mice reveals impaired generation of IPCs. The lineage progression index is calculated by dividing the number of cells of a defined developmental stage by the number of cells of the preceding developmental stage (aNSCs normalized to total NSCs, IPCs normalized to aNSCs, immature neurons normalized to IPCs). Index aNSCs/total NSCs: ctrl = 0.1, Tfamcko = 0.14; index IPCs/aNSCs: Tfamcko = 0.23.
(L and M) Confocal images of TUNEL+ cells in Tfamcko mice (red; arrow); quantification of TUNEL+ cells revealed a significant increase in apoptosis upon deletion of Tfam (M).
(N–P) (N and P) Morphological analysis of newborn neurons in Tfamfl/fl mice 90 days post injection with MMLV vectors encoding for GFP alone (GFP) or for GFP and Cre (GFP Cre) revealed impaired dendritic morphology upon Tfam deletion. (F, G,I, and J) nctrl = 3, ncko = 4; (H) nctrl = 3, ncko = 3; (M) nctrl = 4, ncko = 5; (O) nGFP = 16 cells, nGFP Cre = 20 cells (Table S1). Data represented as mean ± SEM; t test was performed to determine significance; all scale bars = 20 µm.

