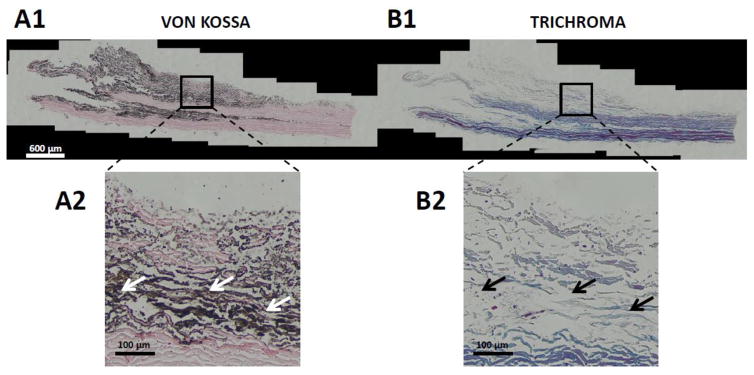
Fig. 12.
Von Kossa and Trichrome staining of a cross section extracted from a crimped bovine pericardial leaflet. Both cross sections were extracted from the same location in the leaflet and then were stained for calcification and ECM investigations. A1 and B1 are mosaic images ( 10 stitched images) of Van Kossa and Trichrome staining of the cross section, respectively. A2 and B2 are two magnified local images to compare the calcification versus ECM. Image A2 and B2 show hydroxyapatite deposition and collagen fibers in the same location of tissue. Black and white arrows represent the calcified and damaged ECM zones in the leaflet. Bars are 600 μm and 100 μm in mosaic and magnified images, respectively. The images are from Kheradvar

