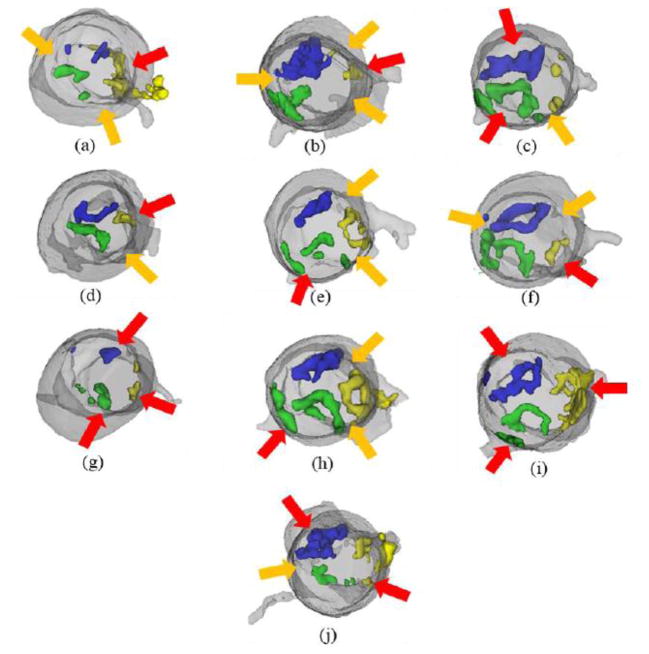
Fig. 3.
Segmented CT scans presenting reconstructed 3D models of the aortic root and calcific lesions overlaid with positions of paravalvular leak after TAVR based on respective transesophageal echocardiography scans. Red arrows correspond to PVL at cusp side and orange arrows correspond to PVL at commissure between two cusps. Green, blue and yellow denote the calcification in the right coronary, non-coronary and left coronary cusps respectively.

