
Figure 2. ARMAN-1 CRISPR array diversity and identification of the ARMAN-1 Cas9 PAM sequence.
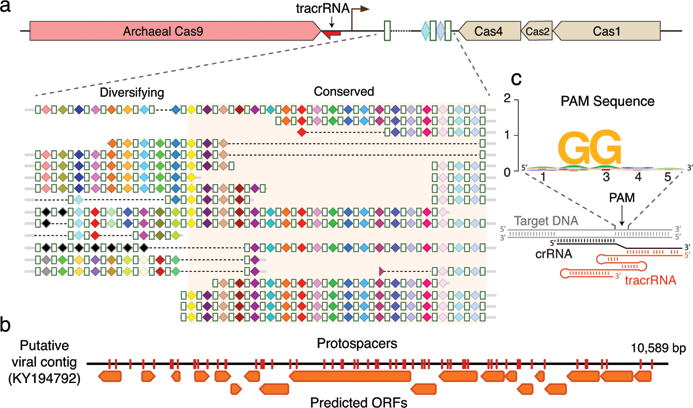
a, CRISPR arrays reconstructed from AMD samples. White boxes indicate repeats and colored diamonds indicate spacers (identical spacers are similarly colored; unique spacers are in black). The conserved region of the array is highlighted. The diversity of recently acquired spacers (on the left) indicates the system is active. Analysis of within-population CRISPR variability is presented in Extended Data Fig. 2. b, A single circular, putatively viral, contig contains 56 protospacers (red vertical bars) from the ARMAN-1 CRISPR arrays. c, Sequence analysis of 240 protospacers (Supplementary Table 1) revealed a conserved ‘NGG’ PAM downstream to the protospacers.