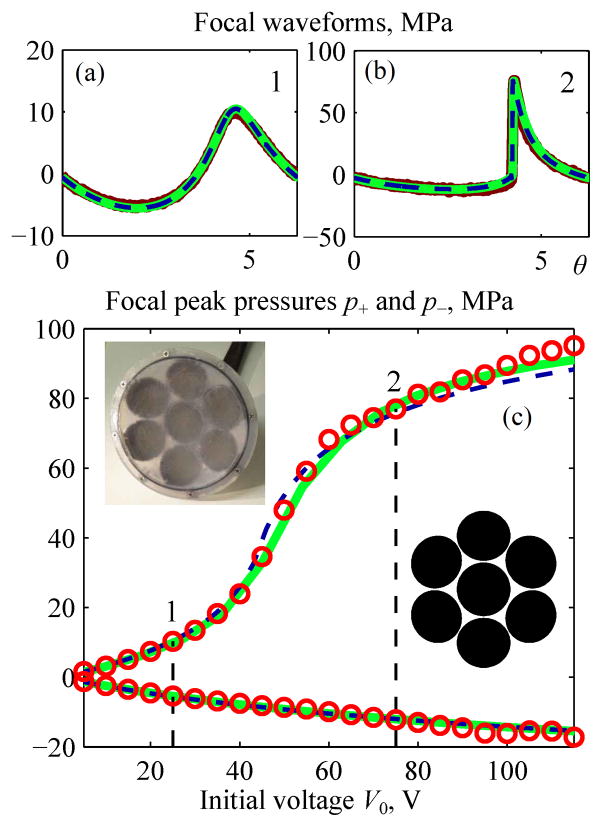
Fig. 14.
Comparison of results for the nonlinear pressure field at the focus of a 1 MHz 7-element array [26]. Measurement data (bold curves for the waveforms and circles for peak pressures) and results from KZK (dashed curves) and Westervelt (solid curves) models are shown for focal waveforms pF(θ) (a), (b) and for focal peak pressures as a function of the voltage V0 applied to the transducer surface (c). Vertical dashed lines mark quasilinear (1) and developed shock (2) levels of distortion; corresponding waveforms (a) and (b) are shown above. Parameters of an equivalent single-element spherical source were determined as a = 6.4 cm, F = 13.2 cm, F# = 1.03, ka = 269.

