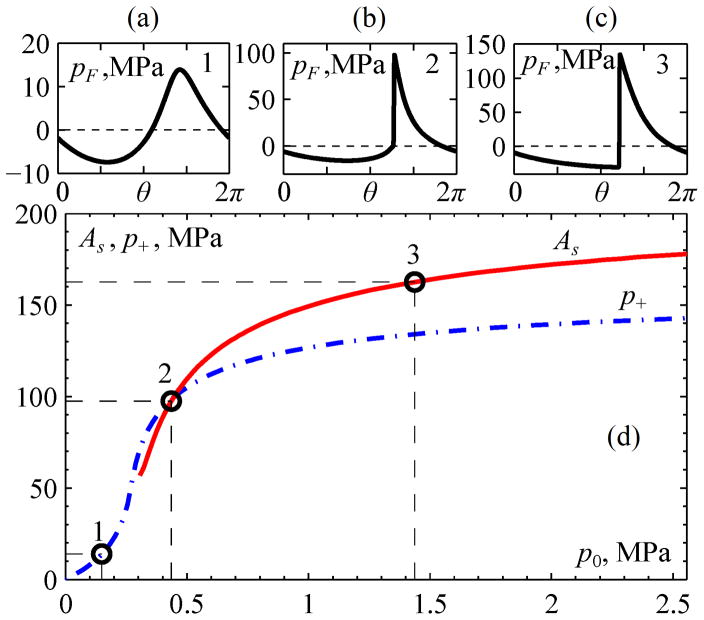
Fig. 5.
Illustration of three characteristic levels of waveform distortion at increasing source pressures, which are proportional to the nonlinear parameter N in the KZK equation (3). The quasilinear level (1), the level of a fully developed shock front (2), and a level in the saturation regime (3) are denoted by numbered circles in the lower plot (d), with corresponding waveforms (a), (b), and (c) above. The solid curve represents shock amplitude As, while the dashed curve shows peak positive pressure p+ in the focal waveform. Plots are presented for a spherical source of 1 MHz frequency: a = 5 cm, F = 9 cm, F# = 0.9.

