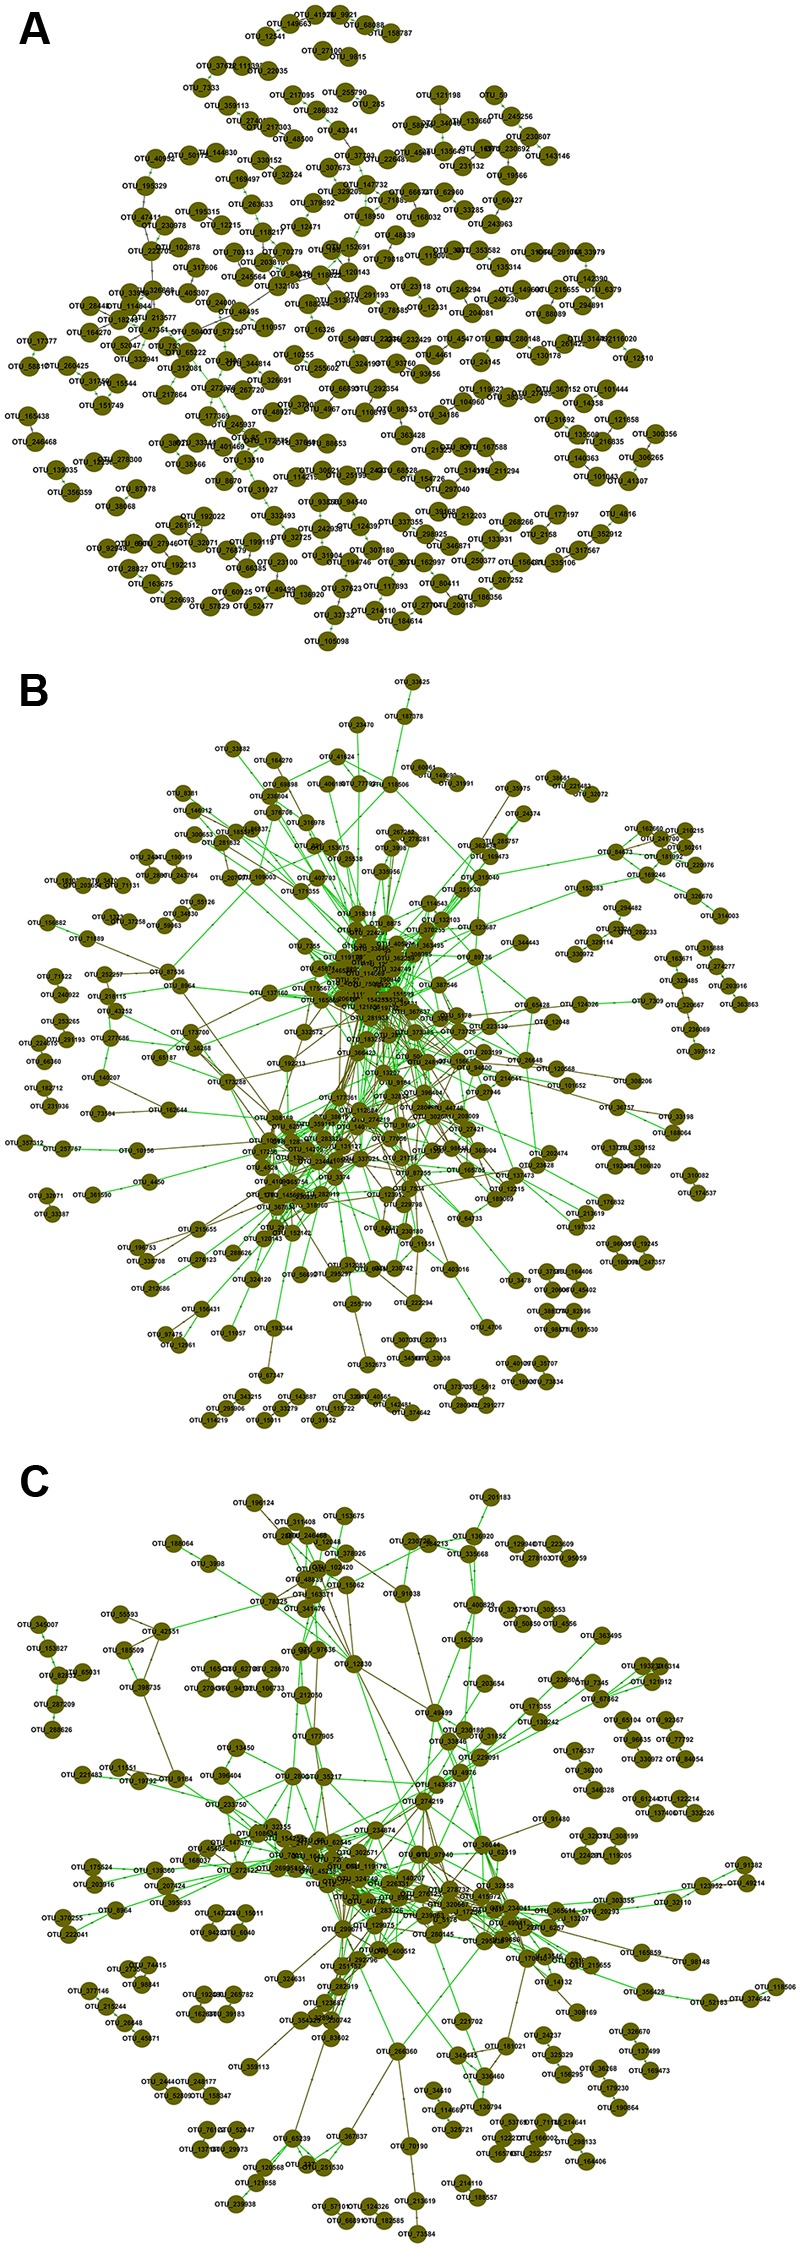
FIGURE 1.

Association networks of OTU data in (A) WLM, (B) FNM, and (C) SNJ. The threshold was determined to be 0.920 based on the random matrix theory (RMT) algorithm. Nodes represent OTUs, green lines represent positive correlations, and brown lines represent negative correlations.
