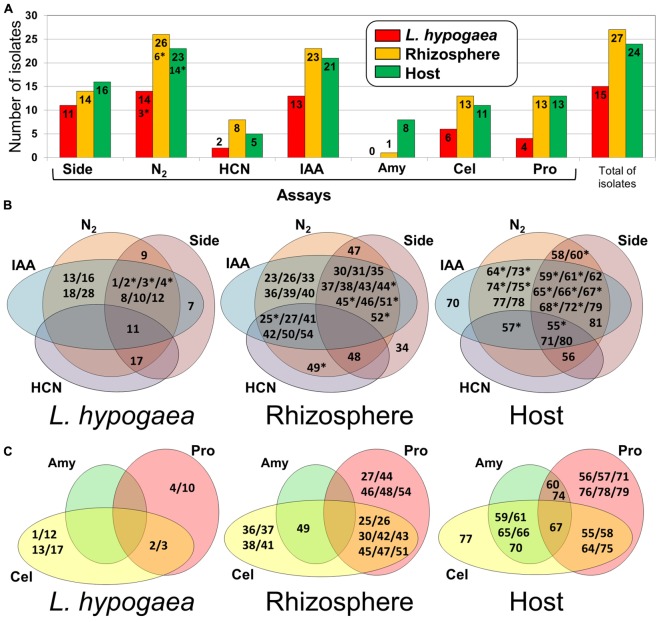
FIGURE 3.
Analysis of biochemical and enzymatic assays. (A) Representativeness of isolates with regard to results of biochemical assays for production of siderophores (Side), N2 fixation (N2), production of HCN (HCN), production of IAA (IAA), and positive activity for amylase (Amy), cellulase (Cel), and protease (Pro). (B) Venn diagrams indicating the potential of each isolate with regard to the biochemical performed (IAA, HCN, N2, and Side) in each niche evaluated (Langs, Rizhos, and Host). (C) Venn diagrams showing the potents of each isolate with regard to the enzymatic assays performed (Cel, Pro, and Amy) in each niche evaluated (Langs, Rhizos, and Host). ∗Denotes the isolates whose nifH were amplified by PCR.

