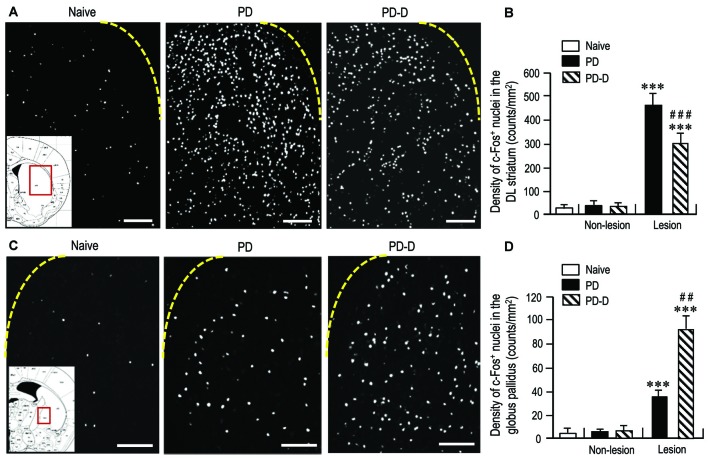
Figure 7.
Effects of dopamine stimulation on striatal and pallidal c-Fos expression in 6-OHDA-lesioned mice. An immunohistochemical study with anti-c-Fos antibody was carried out on the striatal sections from PD and PD-D mice, which received injections of L-DOPA (20 mg/kg) and benserazide-HCl (12 mg/kg) 2 h before sacrifice on day 11 (see Figure 1A), and those from naïve controls that also received the injections of L-DOPA (20 mg/kg) and benserazide-HCl (12 mg/kg) 2 h before sacrifice. The density measurements were performed by counting the numbers of c-Fos-positive (c-Fos+) nuclei in a 0.5 mm × 0.5 mm field in the striatum and globus pallidus from each animal. (A) Representative photomicrographs of the DL striatum stained for c-Fos in naïve control, PD and PD-D mice. The inset (red open box) in the naïve control is the corresponding figure from the atlas of Paxinos and Franklin (2001) to show the striatal area that were analyzed in all naïve control, PD and PD-D mice. (B) Density quantification of c-Fos+ nuclei in the DL striatum from naïve controls (n = 10), and of those on non-lesion and lesion sides in PD (n = 10) and PD-D (n = 10) mice. Data are expressed as means ± SEM. ***P < 0.001 vs. naïve controls; ###P < 0.001 vs. PD; two-way ANOVA (F(1,36) = 140.9) followed by Bonferroni’s test. (C) Representative photomicrographs of the globus pallidus stained for c-Fos in naïve control, PD and PD-D mice. The inset (red open box) in the naïve control is the corresponding figure from the atlas of Paxinos and Franklin (2001) to show the pallidal area that were analyzed in all naïve control, PD and PD-D mice. (D) Density quantification of c-Fos+ nuclei in the globus pallidus from naïve controls (n = 10), and of those on non-lesion and lesion sides in PD (n = 10) and PD-D (n = 10) mice. Data are expressed as means ± SEM. ***P < 0.001 vs. naïve controls; ##P < 0.01 vs. PD; two-way ANOVA (F(1,36) = 80.8) followed by Bonferroni’s test. Scale bars: (A) = 200 μm; (C) = 100 μm.

