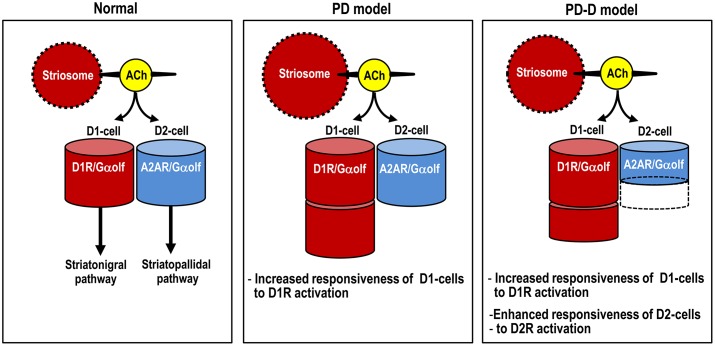
Figure 8.
Proposed diagram for dopaminergic regulation of Gαolf levels that determine responsiveness to dopamine stimulation in striatal D1- and D2-cells. The heights of the red and blue columns indicate the abundance of Gαolf proteins in D1-cells and D2-cells, respectively. In PD mice, D1-cells might exhibit the dopamine D1R hypersensitivity caused by a dramatic increase in their Gαolf levels, while D2-cells might show no apparent changes in their Gαolf levels. In PD-D mice, D1-cells might show an increase in their Gαolf levels, while D2-cells might show a decrease in their Gαolf levels, which might result in an enhanced responsiveness to D2R activation. Abbreviations: PD, Parkinson’s disease: PD-D, PD with dyskinesia; ACh, acetylcholine; D1-cell, dopamine D1 receptor-expressing striatonigral medium spiny neuron; D2-cell, dopamine D2 receptor-expressing striatopallidal medium spiny neuron; D1R, dopamine D1 receptor; D2R, dopamine D2 receptor; Gαolf, olfactory type G-protein α subunit.

