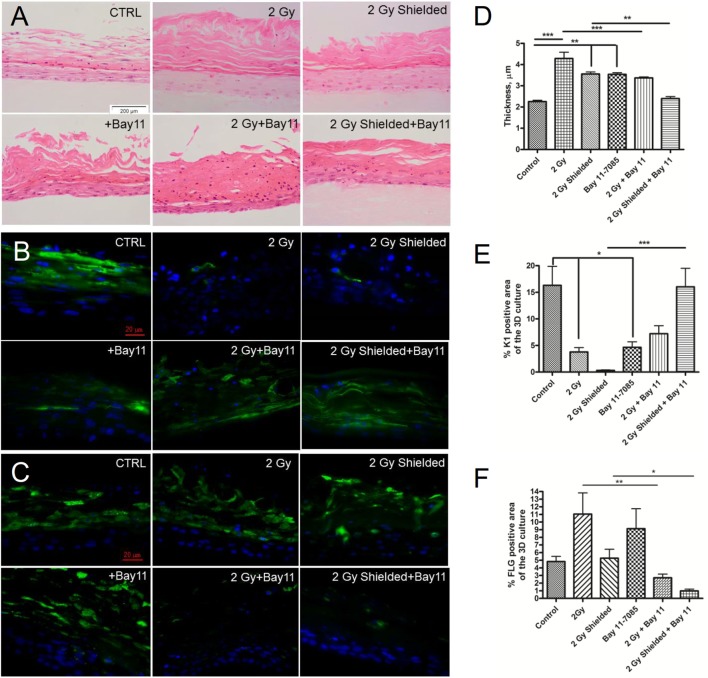
Figure 6.
H&E staining—morphological analysis of the 3D cultures after irradiation and incubation of the 3D epidermal model with 1 µmol/l specific NF-κB inhibitor for a period of 7 days (A). Cytokeratin 1 (B) and filaggrin (FLG) (C) expression in 1 µmol/l Bay 11-7085 treated 3D organotypic skin cultures 7 days after irradiation. Changes in the cornified layer thickness are calculated by Image J (D). Quantification of K1 and FLG expression in the same 3D cultures by Image J as described in Section “Materials and Methods” (E,F). Blue—DAPI; green—K1. Results are arithmetical mean from two independent experiments. *p < 0.05; **p < 0.01; ***p < 0.001, one-way ANOVA analysis, Tukey posttest.

