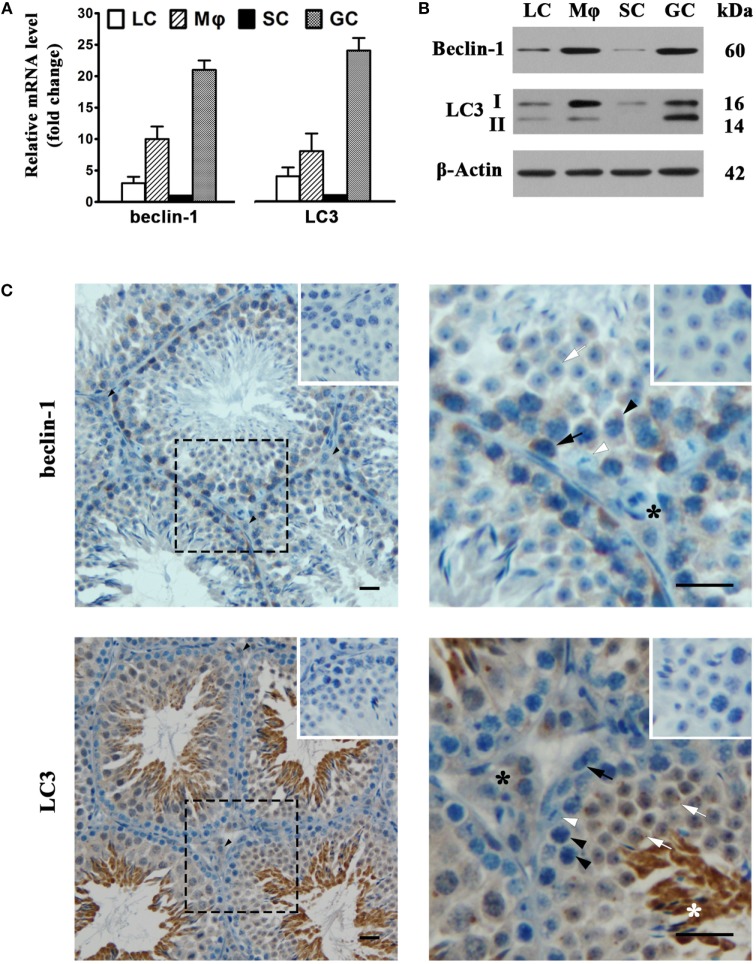
Figure 6.
Autophagy-related gene expression. (A) The mRNA levels of beclin-1 and light chain 3 (LC3). Testicular cells were isolated from 4-week-old mice. Relative mRNA levels of beclin-1 and LC3 were determined using real-time qRT-PCR. (B) Protein levels of beclin-1 and LC3. Testicular cell lysates were subjected to Western blot analysis. β-Actin was used as loading control. (C) Cellular distribution of beclin-1 and LC3. The paraffin sections of the testes from 5-week-old mice were subjected to immunohistochemistry analysis to locate beclin-1 (upper panels) and LC3 (low panels) using specific antibodies. Insets in the upper right corners represent negative controls, in which pre-immune rabbit sera served as primary antibodies. Black arrows, spermatogonia; black arrowheads, spermatocytes; white arrows, round spermatids; white arrowheads, Sertoli cells (SC); black asterisks, interstitial cells; white asterisks, elongating spermatids. Data are presented as the means ± SEM of three experiments. Images represent at least three independent experiments. Scale bars, 20 µm.

