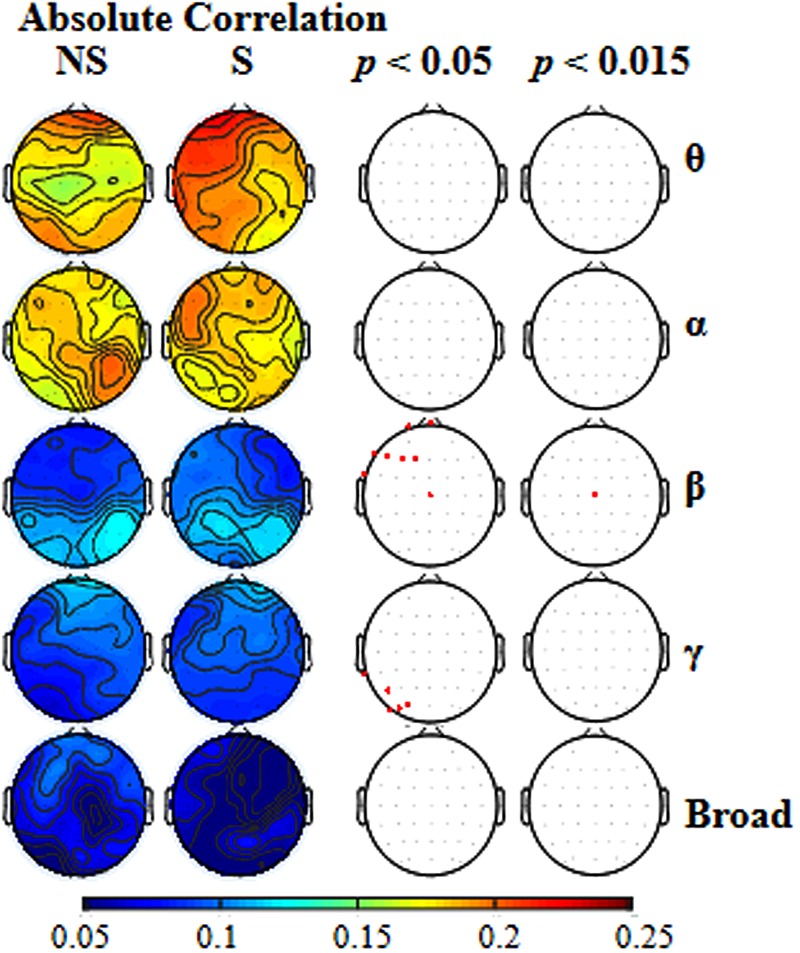
FIGURE 3.

The two left columns: for each of the five types of frequency bands [theta (𝜃), alpha (α), beta (β), gamma (γ), broad], the scalp topographical maps showing location distributions of absolute correlations between the EEGs to the mixed-speech complex and EEGs to a single speech under either the non-selective attention (NS) condition or the selective attention (S) condition. The two right columns: for each of the frequency bands, the recordings sites at which the correlation difference between the two attention conditions was significant when the p level was either 0.05 and or 0.015.
