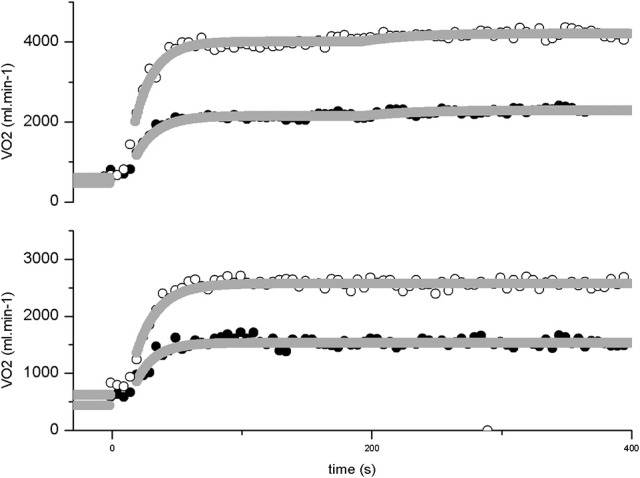
Figure 2.

response profile in two example subjects in a square wave transition to moderate (lower panel) and heavy (upper panel) swimming. Breath-by-breath data of the female swimmer is shown in closed circles and of the male swimmer in open circles. The Gray lines represent the best fit as determined from the exponential modeling procedure (dark gray for the female and light gray for the male). The data is expressed in absolute values.
