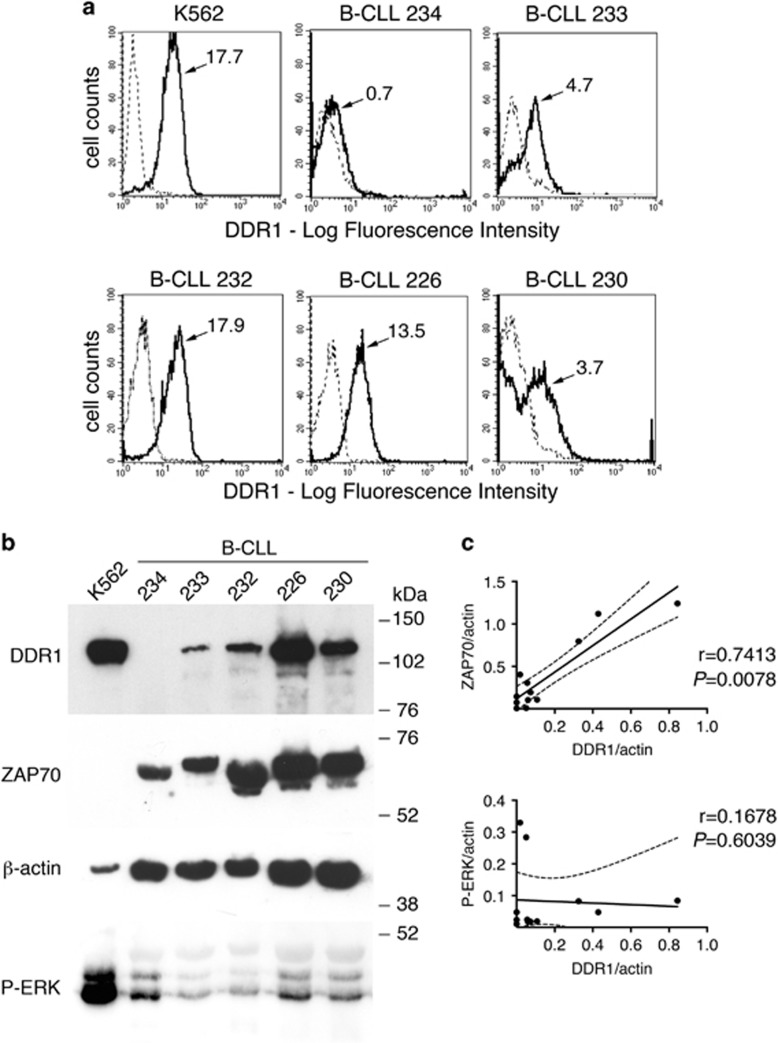
Figure 2.
(a) Peripheral blood mononuclear cells from CLL cases express variable levels of surface DDR1 as detected by immunofluorescence and fluorescence-activated cell sorter analysis, gated on lymphoid cells; (b) western blot analysis of DDR1, ZAP70 and pERK1/2: DDR1 showed a predominant band of an apparent mw of ~130 kDa. K562 erythroleukemia cell line is shown as positive control (c) Densitometry analyses of ZAP70 and DDR1, relative to actin control, showed a significant correlation, whereas no correlation with phosphorylated ERK1/2 (P-ERK) was found (analysis includes also western blots shown in Supplementary Figure S2).

