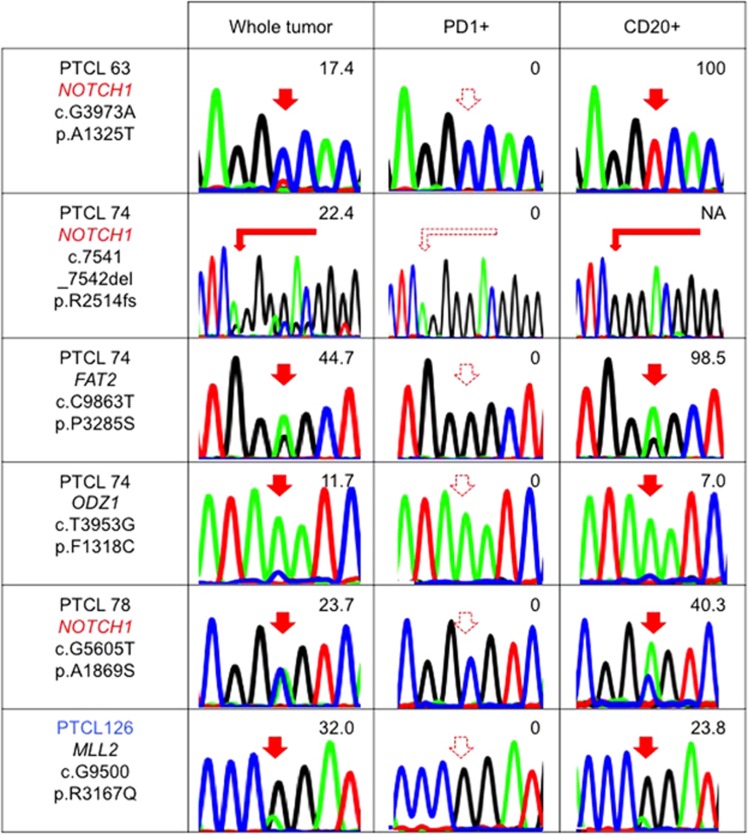
Figure 5.
B-cell-specific mutations in nodal T-cell lymphomas. The results of Sanger sequencing and/or amplicon-based deep sequencing for some newly identified gene mutations in whole tumor, PD1+ cells and CD20+ cells are shown. The numeric values indicate allele frequencies of mutations defined by deep sequencing. The AITL samples are indicated in black letters. The PTCL-NOS/nodal PTCL with TFH phenotype sample is indicated in blue letters. NA, not analyzed by deep sequencing. The filled and dashed red arrows indicate mutations and no mutations, respectively. NOTCH1 is marked by red letters because this is repetitive.

