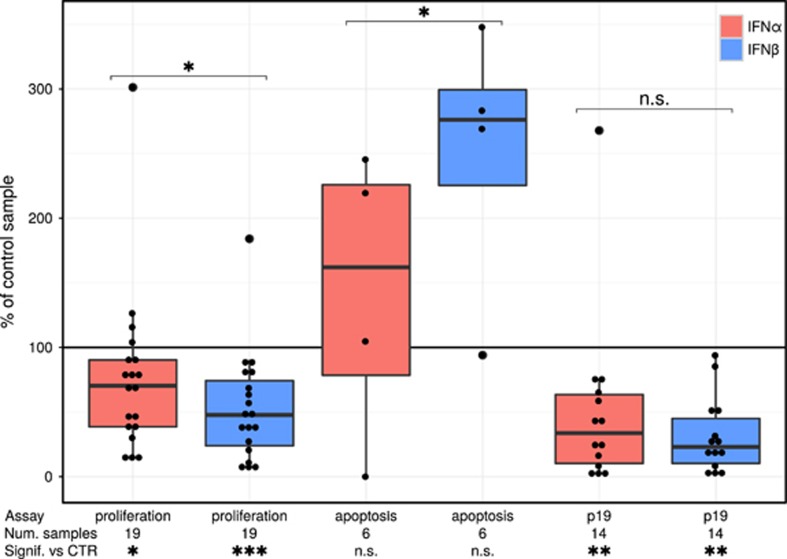
Figure 1.
Boxplots of the effects of IFN-α and IFN-β on measured proliferation, apoptosis and viral protein p19 production in ex vivo PBMCs of ATL patients. Proliferation was quantified by [3H] incorporation, apoptosis through flow cytometry of active caspase-3 and viral protein was quantified using ELISA. Each sample was treated in parallel in three different conditions: either left untreated, stimulated with 1000 IU of IFN-α or IFN-β (red and blue, respectively). The data are depicted here as the percentage of the value measured in the corresponding untreated control condition of the sample. Statistical significance of the Friedman rank sum test (*P<0.05, **P<0.01, ***P<0.001) and number of samples used in the comparison of each condition versus its control (CTR) is indicated underneath the graph. Statistical significance of the difference between IFN-α and IFN-β is depicted above the boxplots. All the datapoints are shown in the graph, excepting two samples that had no measurable apoptosis in the untreated control condition. These could not be included in this graph, but have been used in the statistical comparison of significance versus control.

