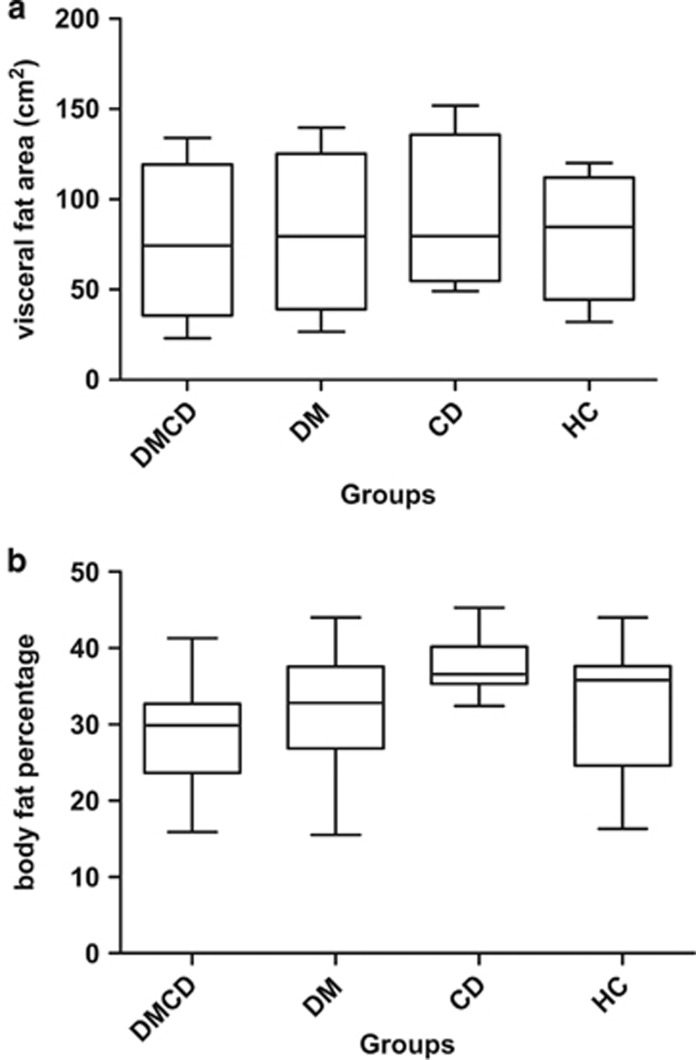
Figure 1.
Visceral fat area and percentage of body fat according to dual energy X-ray absorptiometry ( DEXA) among all four different groups. CD, celiac disease only; DM, type 1 diabetes only; DMDC, type 1 diabetes mellitus and celiac disease; HC, healthy control. Values are expressed as means ±s.d., median and range (minimum and maximum). (a) Visceral fat area (cm2) and (b) body fat percentage.

