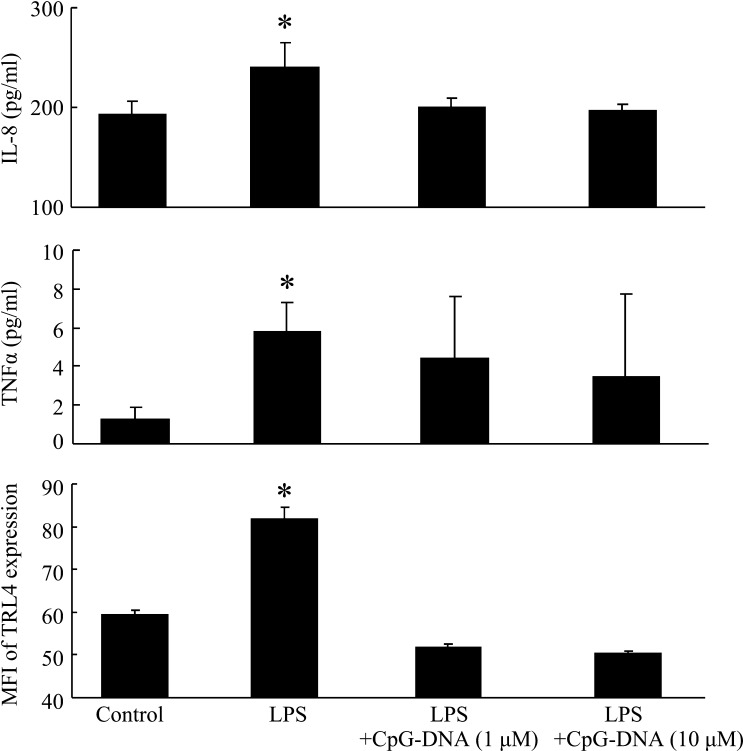
Fig. 3.
The IL-8 and TNFα productions and MFI of TLR4 expression in LPS-stimulated INT-407 cell cultures in the presence of CpG-DNA. INT-407 cells were cultured with LPS (10 µg/ml) and the indicated CpG-DNA (1 or 10 μM) for 48 hr. The IL-8 and TNFα concentrations in the cell cultures were measured using ELISA. The MFI of TLR4-positive cells was then determined using a Guava easyCyte flow cytometry single sample system. Data are presented as the mean ± SD (n=3). *p<0.05 (compared with control using Dunnett’s multiple comparison test).

