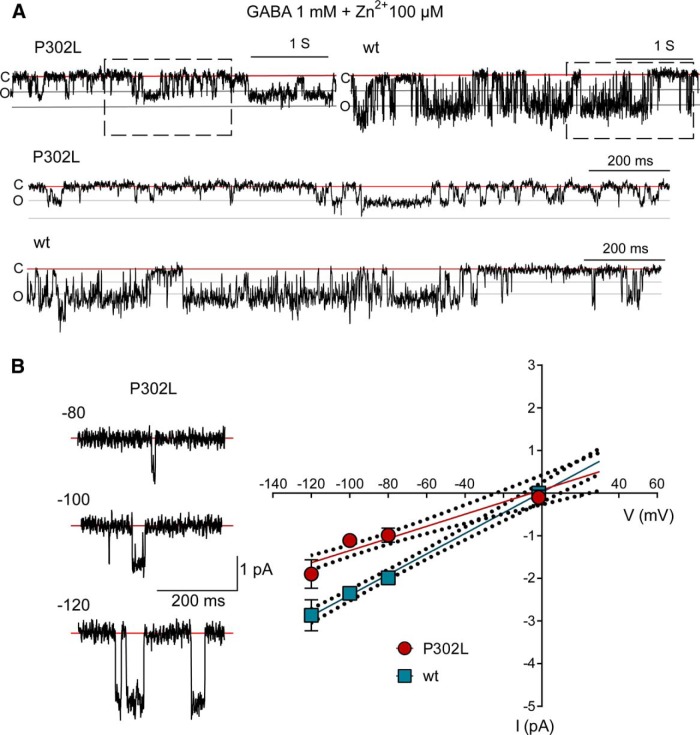
Figure 10.
The low-conductance γ2(P302L)GABAA receptors were zinc insensitive. A, Single-channel current traces from cell-attached patches of mutant γ2L(P302L) and wt recorded at +80 mV and continuously exposed to 1 mM GABA and 100 µM zinc. Cluster openings were downward. Upper panels were representative traces continuously recorded for 4000 ms. Red lines indicated that the channel was closed (C), while the gray lines indicated when the channel was open (O) in steps of 1 pA. Dashed boxes enclosed an expanded section of 1600 ms, which was shown below as indicated. B, Representative low-conductance current traces from cell-attached patches of mutant γ2L(P302L) receptors recorded at various membrane potentials in the presence of 1 mM GABA and 100 µM zinc. For the linear regression analysis of conductance, the membrane potentials were indicated as negative values. The traces were recorded from the same patch at the membrane potentials indicated. The red lines represented the closed state of the channels. In the right panel, single-channel current-voltage (I/V) plots of mutant γ2L(P302L) and wt receptors were shown. The amplitude of the most frequently occurring opening was used for the construction of the I/V plots. Thus, low-conductance openings were used for the mutant receptor, whereas main-conductance openings were used for wt receptors. Data points were values expressed as mean ± SEM (n = 3-5 cells for each experimental condition). Solid lines represented fits of the linear regression equation, and the doted lines represented 95% confidence intervals of the best-fit line. Zn2+, zinc.

