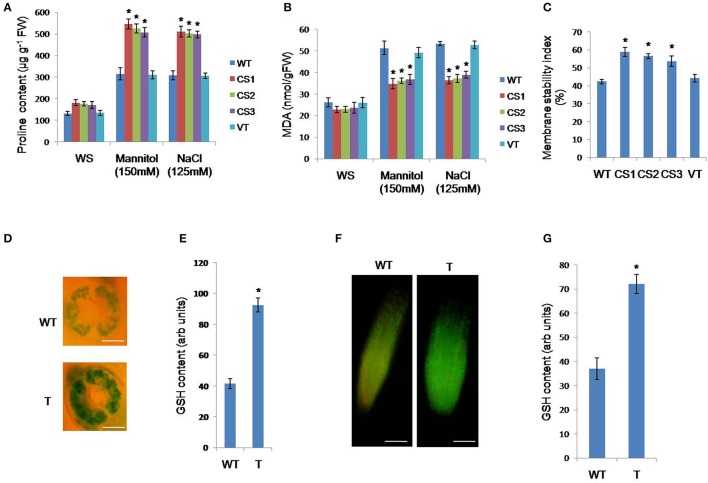
Figure 5.
Measurement of proline, MDA, osmotic potential, cell membrane stability and relative water contents of transgenic plants. Two-week-old seedlings of WT, VT, and transgenics were grown on 150 mM mannitol for 3 days, for estimation of proline (A), MDA (B). Cell membrane stability (C) of transgenics, WT and VT seedlings were treated with 150 mM NaCl. Two-week-old A. thaliana seedlings, grown on MS medium, were subjected to mannitol (150 mM) for 2 days. GSH content in guard cells (D,E) and root meristem (F,G) of WT and transgenic plant. T represents CcCKS-transgenic and WT represents wild-type. Bar represents mean, and error bars represents SE from three independent experiments. For each treatment, 20 seedlings were used. Asterisks indicate significant differences in comparison with the WT at P < 0.05. WT, wild type; VT, vector transformed; CS1, CS2, and CS3: three different transgenic lines. (D) Scale bar 50 μm; (F). Scale bar 100 μm.

