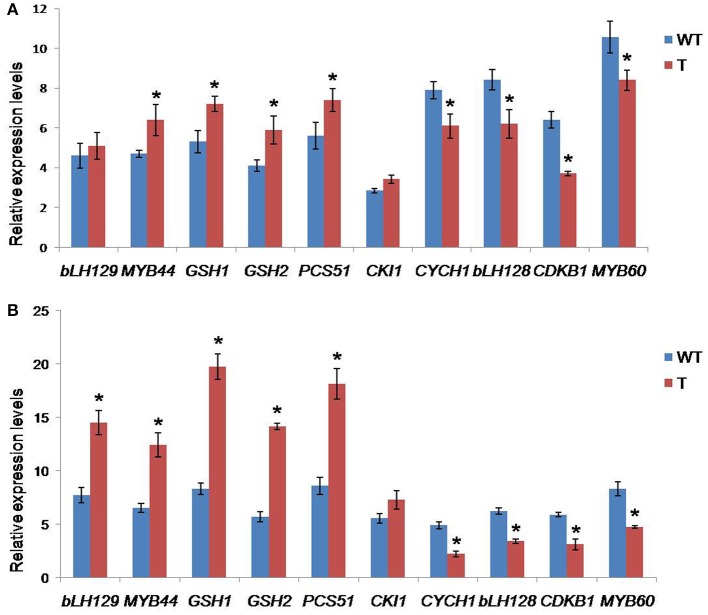
Figure 9.
qRT-PCR analysis for the expression profiles of selected genes in wild type and transgenic Arabidopsis under drought stress. Comparisons of the relative transcript levels of different genes in CcCKS-transgenic (T) and wild-type (WT) plants under normal (A) and 150 mM mannitol (B) stress conditions. Actin was used as a reference gene. The vertical column indicates the relative transcript level. Bar represents mean and error bars represents SE from three independent experiments. Asterisks indicate significant differences in comparison with the WT at P < 0.05.

