Figure 6.
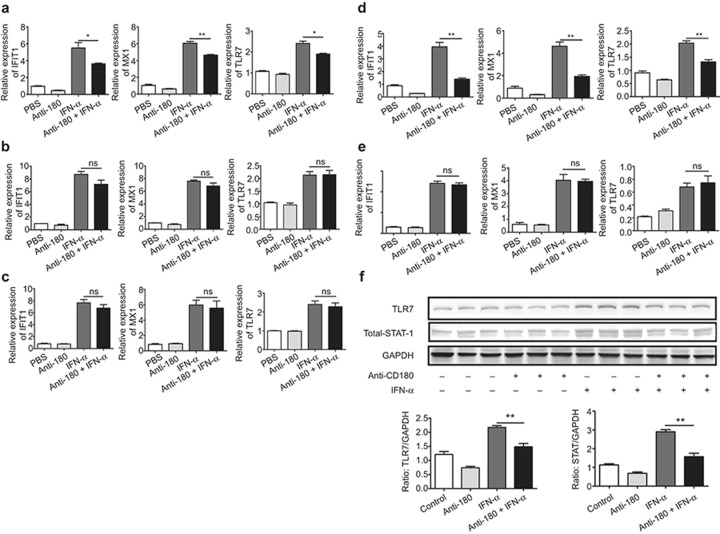
In vivo study of the inhibitory effect of anti-CD180 on the activation of IFN-α signaling. Female C57BL/6 mice (n = 24) were randomly divided into four groups: (a) PBS; (b) anti-CD180; (c) IFN-α; (d) anti-CD180+ IFN-α. The mice were IP injected with 200 μl PBS, 200 μl PBS containing 100 μg anti-CD180 antibody or 10 000 U IFN-α. Six hours later, the mice were euthanized. (a–c) qPCR analysis of the expression of IFIT1, MX1, and TLR7 in spleen (a), bone marrow (b), and PBMCs (c). (d and e) qPCR analysis of the expression of IFIT1, MX1, and TLR7 in purified splenic B220+ B cells (d) and B cell-removed splenocytes (e). (f) Western blot analysis of the protein levels of TLR7 and STAT-1 in purified splenic B220+ B cells. The data shown represent the mean values of three independent experiments, and the error bars represent the SEM. *p < 0.05, **p < 0.01, ***p < 0.001, as determined by ANOVA; ns denotes p > 0.05.

