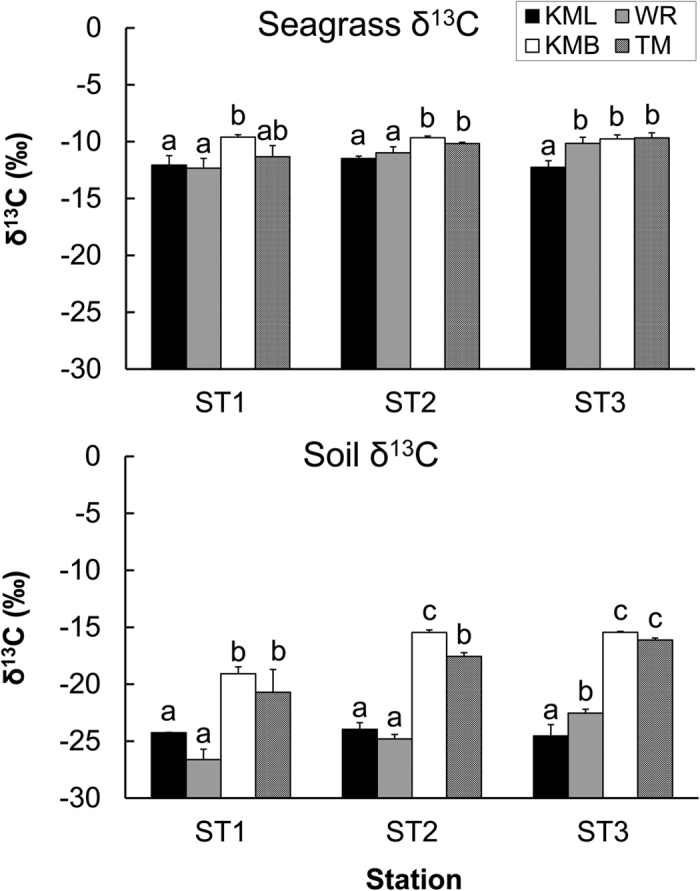
Figure 4.

δ13C of seagrass (a) and soil organic carbon (b) in the four seagrass meadows in North Sulawesi (mean and standard deviation of three replicates are shown). Same abbreviations as Fig. 2. At each sampling station, different letters indicate significant difference among the four sites according to ANOVA test.
