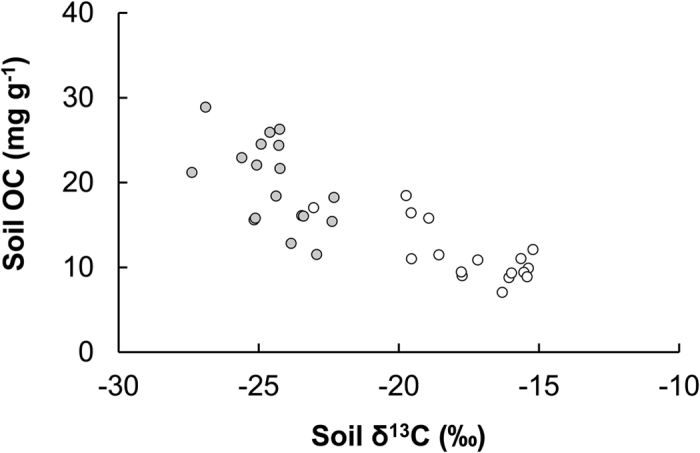
Figure 5. The relationships between the concentration and δ13C of soil OC in seagrass meadows (n = 36).

White symbols: data from non-mangrove adjacent seagrass meadows; grey symbols: data from mangrove adjacent seagrass meadows.

White symbols: data from non-mangrove adjacent seagrass meadows; grey symbols: data from mangrove adjacent seagrass meadows.