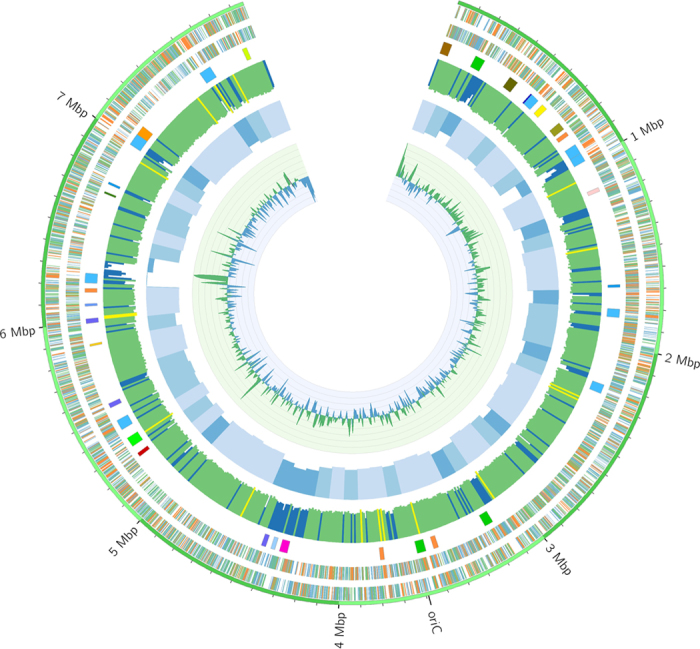
Figure 1. Schematic representation of the Streptomycessp. MP131-18 genome (scaffold 1 only), created with the help of Circos58.

Megabases are labeled; smaller ticks correspond to 100 kbp segments. From outside: genes on the forward and the reverse strands (blue: shorter than 900 bp, green: between 900 and 1500 bp long, orange: longer than 1500 bp); 35 secondary metabolite clusters colored by predicted type; G+C content, 10 kbp window (blue color highlights segments with G+C content <69%, yellow highlights correspond to G+C content over 76%); G+C content, 100 kbp window (lighter blue is higher G+C, darker blue is lower G+C content); G+C skew (green: positive; blue: negative).
