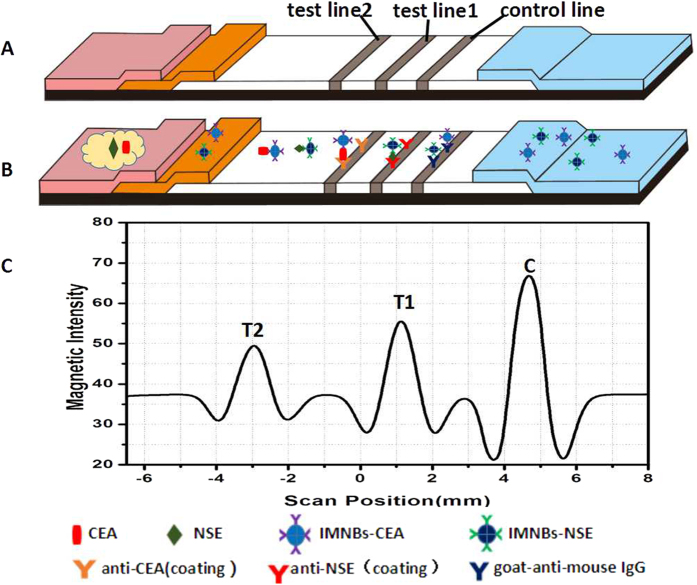
Figure 1. Schematic illustration of the lateral flow assay.
(A) Components of test strip. (B) Samples with NSE and CEA were applied to the sample pads, and migrated along the strip, NSE and CEA combined with their corresponding probe respectively. The complexes migrated along the membrane and were captured by the coating antibodies to form a sandwich complexes on T1 and T2. Then the excess probes were captured by control line. (C) The intensity of magnetic signal was measured by a magnetic assay reader. The peak values from right to left represent the magnetic intensity of control line, test line 1 and test line 2, respectively.

