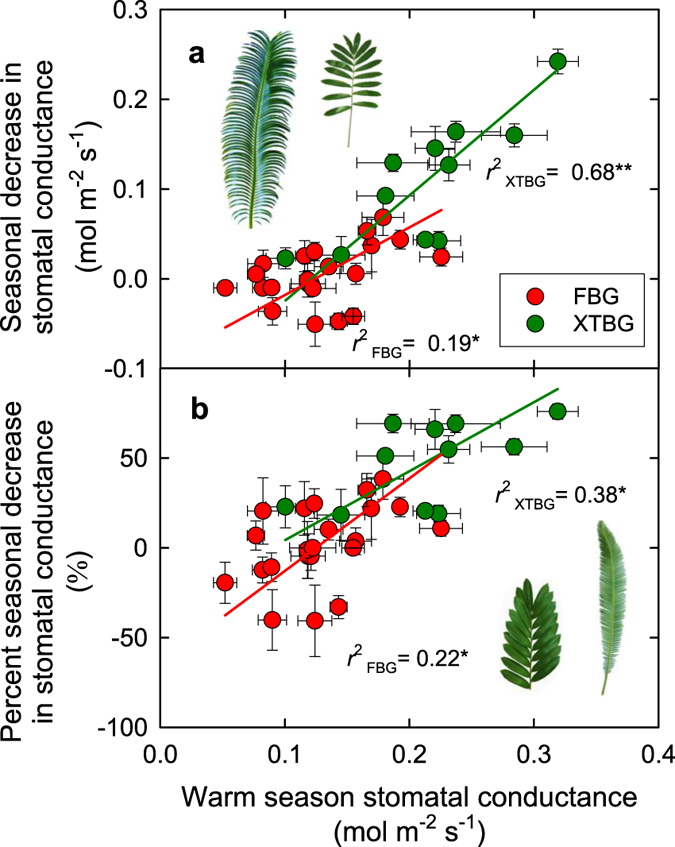
Figure 3.

The relationships between seasonal decrease in stomatal conductance (gs) and gs (a), and between percent seasonal decrease in gs and warm season gs (b). Points denote means ± SEs. Red points represent cycads in Fairylake Botanical Garden (FBG), while green points cycads in Xishuangbanna Tropical Botanical Garden (XTBG). The red lines are standardized major axis (SMA) lines fitted to the species in FBG, while green lines species in XTBG. *P < 0.05; **P < 0.01; ***P < 0.001. Photo credit: Y-J Zhang.
