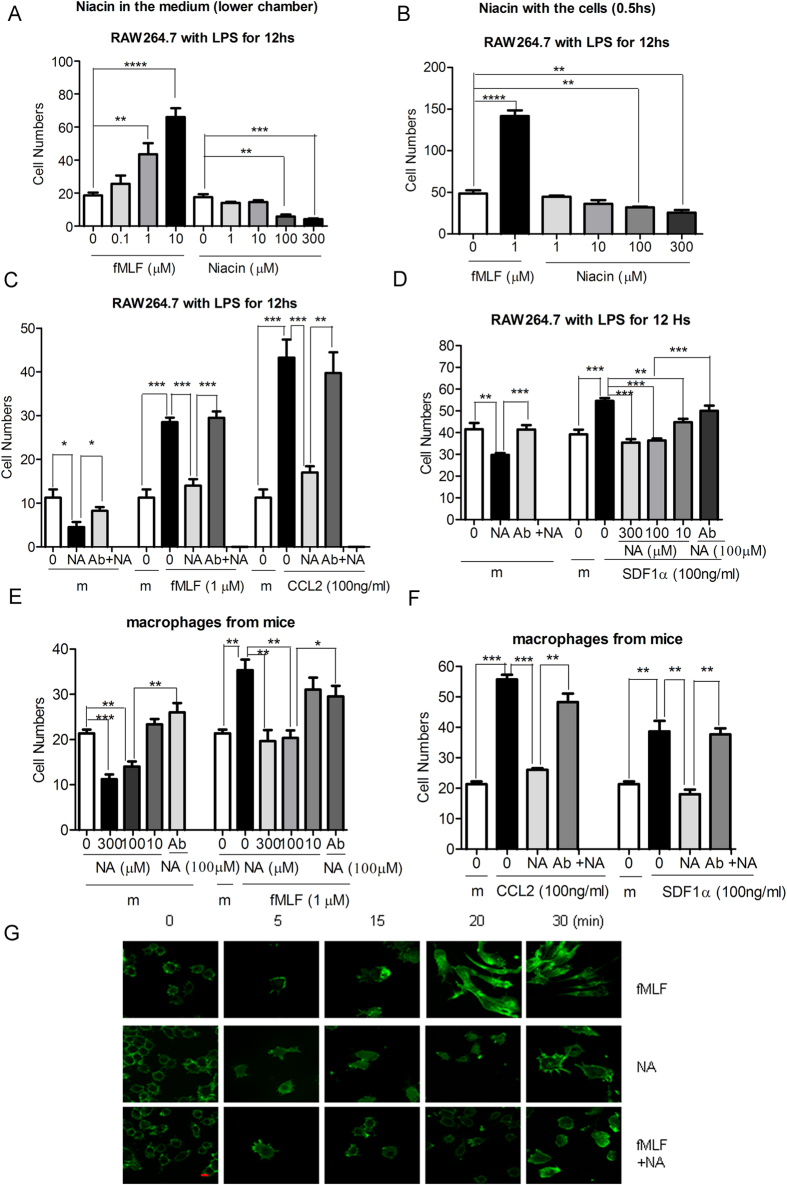
Figure 2. Niacin inhibited macrophage chemotaxis induced by fMLF, CCL2 and SDF1α (CXCL12).
(A–D) RAW264.7 cells treated with LPS for 12 hs. (E,F) Primary macrophages isolated from mice. A. Niacin was placed in the lower wells of the chemotaxis chamber to test its chemotractic activity. (B–F) RAW264.7 cells were cultured with niacin for 30 min or pre-treated with HCA2 antibody for 30 min follewed by niacin. fMLF, SDF1α and CCL2 were then used to induce cell chemotaxis. The data are presented as the mean ± SE of triplicate values from an experiment with three to six repetitions (*p < 0.05; **p < 0.01; ***p < 0.001; ****p < 0.0001, compared to the indicated control). G. Zigmond chamber assay of LPS-treated RAW264.7 cells in response to fMLF gradient (0–10 μM), Niacin gradient (NA, 0–100 μM), and both fMLF and Niacin gradient (left groove: medium, right groove: 10 μM fMLF and 100 μM NA) for different times. F-actin was stained by FITC-phalloidin and images were acquired by confocal microscopy (bar: 10 μM).

