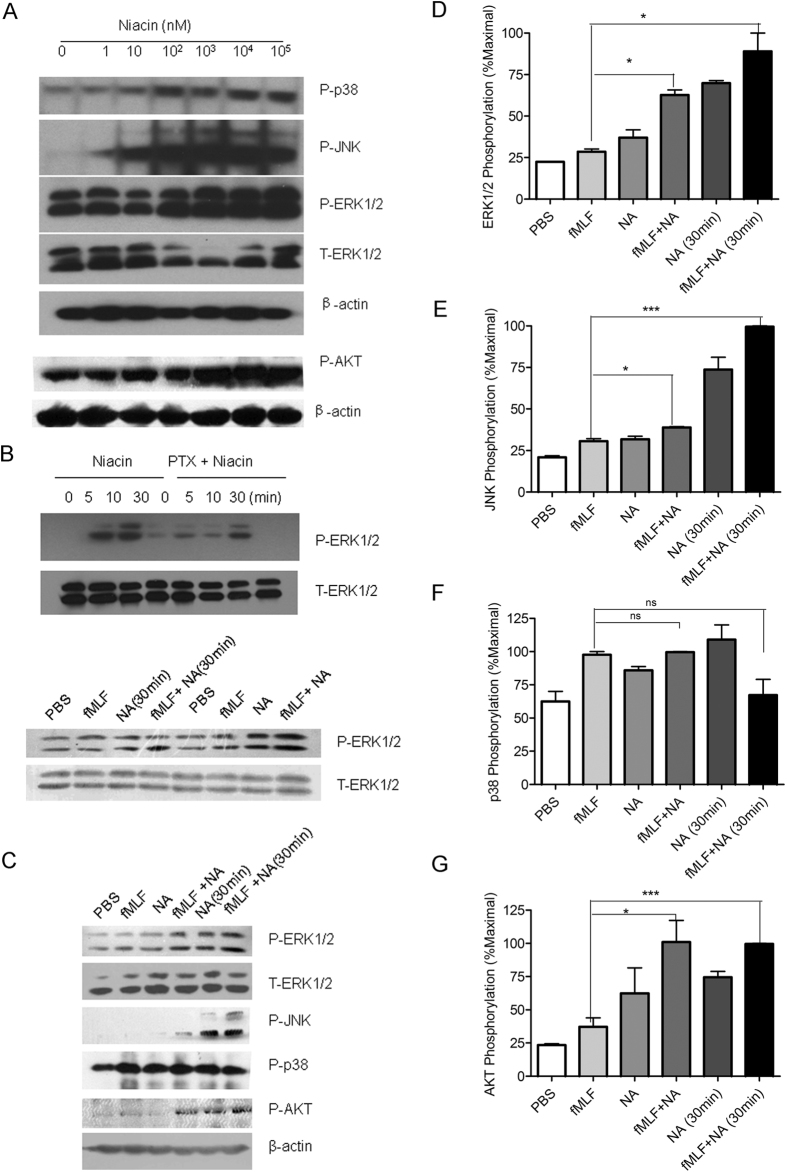
Figure 4. ERK1/2, JNK, P38, and AKT activation induced by fMLF and niacin in RAW264.7 cells treated with LPS for 12 hs.
(A) Cells treated with different concentrations of niacin for 5 min. (B) Cells treated with 100 μM niacin for different times. Cells pre-treated with PTX (50 ng/ml) overnight were used as the control. (C–G) Additive effects of ERK1/2, JNK and AKT phosphorylation induced by fMLF and NA. RAW264.7 cells were treated with PBS (5 min, lane 1), 1 μM fMLF (5 min, lane 2), 100 μM NA (niacin, 5 min, lane3), fMLF and NA (5 min, lane 4), or 100 μM NA (30 min, lane5), fMLF and NA (5 min; 30 min, lane 6). ERK1/2, JNK, p38 and AKT phosphorylation was detected by Western blot (C). ERK1/2, JNK, p38 and AKT phosphorylation was quantified by densitometric analysis and normalized against loading control (T-ERK or β-actin) (D–G). The phosphorylation is expressed as the percentage of the maximal signal in the same experiment. Statistical differences were analyzed with t-test (PRISM software) (*p < 0.05; **p < 0.01, ***p < 0.001, ns: no significant difference, between the two indicated groups).

