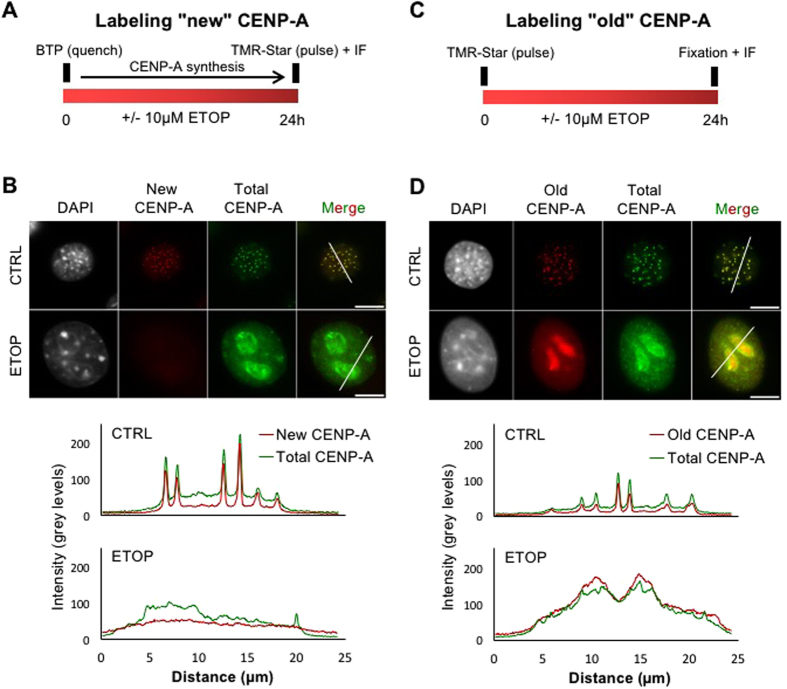
Figure 2. Parental CENP-A is delocalized from centromeres upon DNA damage.
(A) Schematic representation of the assay used to monitor sub-nuclear localization of newly synthesized CENP-A-SNAP proteins after ETOP treatment using fluorescence microscopy on NIH/3T3 cells stably expressing SNAP-tagged CENP-A. Pre-existing SNAP-tagged CENP-A was quenched with a non-fluorescent substrate (BTP) so that only histones neo-synthetized during the chase period can be further labelled with tetramethylrhodamine (TMR-Star; red) during the pulse step. ETOP treatment was performed during the chase and cells were fixed after 24 hr followed by an IF as in Fig. 1A. (B) Detection of total CENP-A using anti-CENP-A antibodies (green) and tagged parental CENP-A (red) following protocol A. Fluorescence intensity line scan through each nucleus (white bar) are represented below images and show the broad nucleolar profiles of total (green line) CENP-A in response to ETOP whereas newly synthesized exogenous CENP-A (SNAP; red line), normally loaded in G1, cannot be incorporated nor accumulates in G2-arrested cells. (C) Schematic representation of the assay used to monitor sub-nuclear localization of pre-existing CENP-A proteins after ETOP treatment, using fluorescence microscopy on NIH/3T3 cells stably expressing SNAP-tagged CENP-A. Pre-existing CENP-A-SNAP proteins were labelled with TMR-Star followed by a chase in presence or absence of ETOP. Cells were fixed after 24 hr and IF was performed as in Fig. 1A. (D) Same as in (B) except that cells were processed following protocol C. Fluorescence intensity line scans through each nucleus show regular punctate pattern in control cells for both exogenous parental (SNAP; red line) and total (green line) CENP-A, whereas ETOP-treated cells show broader signals.

