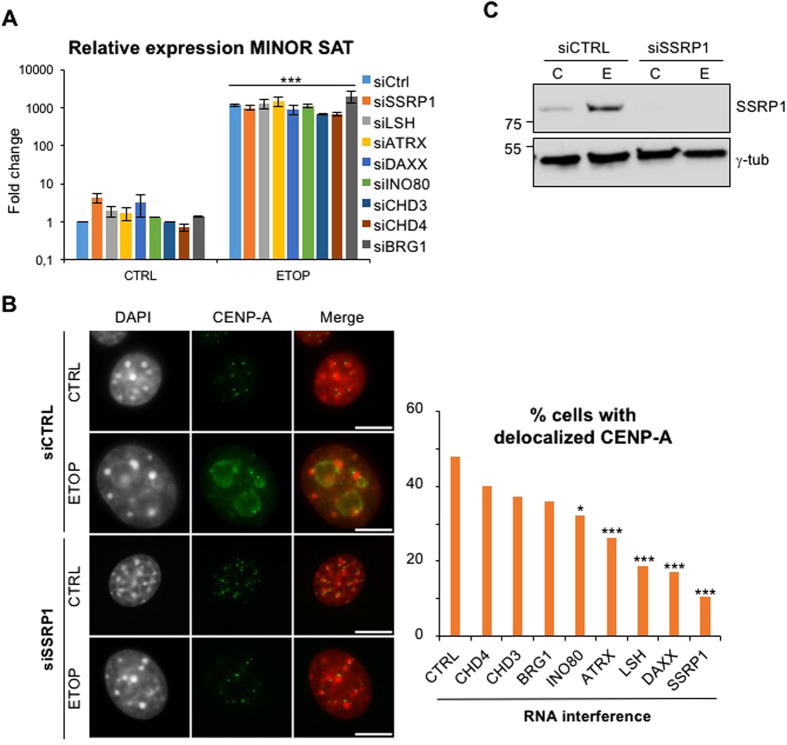
Figure 6. CENP-A delocalization is dependent on chromatin remodelers and the FACT complex.
(A) Minor satellites transcription following knock down of SSRP1 or other chromatin remodelers/chaperones, was analyzed by qRT-PCR as in Fig. 4A. Histogram represents relative fold change values normalized to U6 RNA levels. Value in untreated cells (CTRL) transfected with control siRNA was arbitrarily set at one. Error bars represent S.E.M of at least 3 independent experiments. ***p < 0.001 (unpaired t-test). (B) Impact of SSRP1 knock down, compared to control siRNAs, on CENP-A delocalization in NIH/3T3 cells after a 24 hr ETOP treatment, analyzed as in Fig. 1A. Percentage of cells that displayed CENP-A delocalization in ETOP-treated cells after knock down of SSRP1 or other chromatin remodelers/chaperones are indicated on the histogram on the right (n > 300 cells). Images represent one focal plan. Scale bar, 10 μm. ***p < 0.001 (chi-square test). (C) Efficiency of SSRP1 protein knock down using specific compared to control siRNAs, analyzed by western blot. Levels of γ-tubulin served as a loading control.

