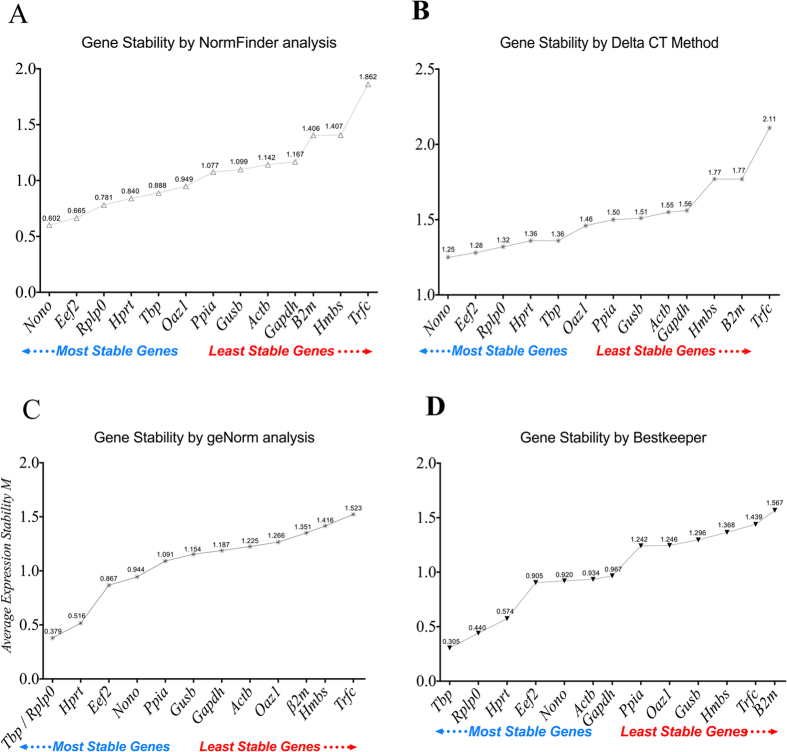
Figure 3.
Gene expression stability values of the 13 reference genes analyzed by defined criteria (A) NormFinder (B) Delta CT Method (C) geNorm Analysis (D) BestKeeper analysis for 24 colon samples from the control groups (PBS 1%, DNBS + PBS 1%, Ethanol 30%), while DNBS-induced colitis group (DNBS + Ethanol 30%), n = 6/group. Lower values refer to higher stability and higher values refer to a lower stability.

