
Figure 4. Comprehensive gene stability ranking for the 13 reference genes used in DSS-induced colitis and control groups.
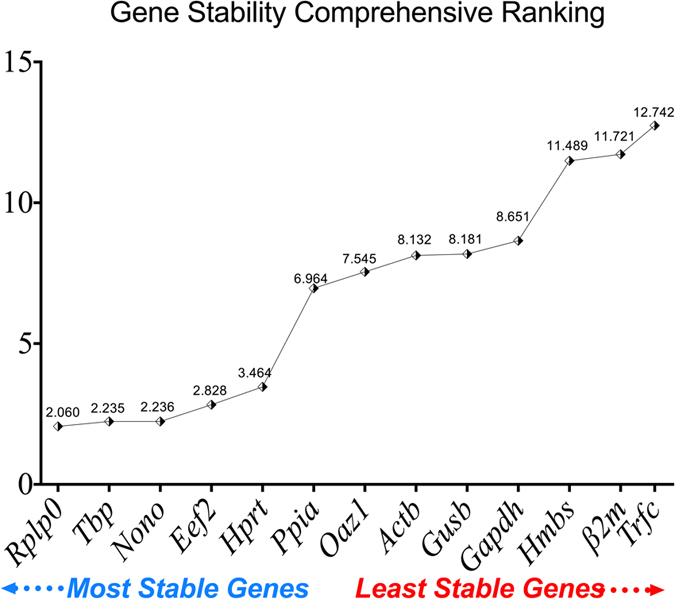
RT-qPCR was carried out for each of the 13 reference genes using the same RNA samples from control groups (PBS 1%, DNBS + PBS 1%, Ethanol 30%) and DNBS-induced colitis group (DNBS + Ethanol 30%). CT values were used to calculate the comprehensive gene stability ranking.