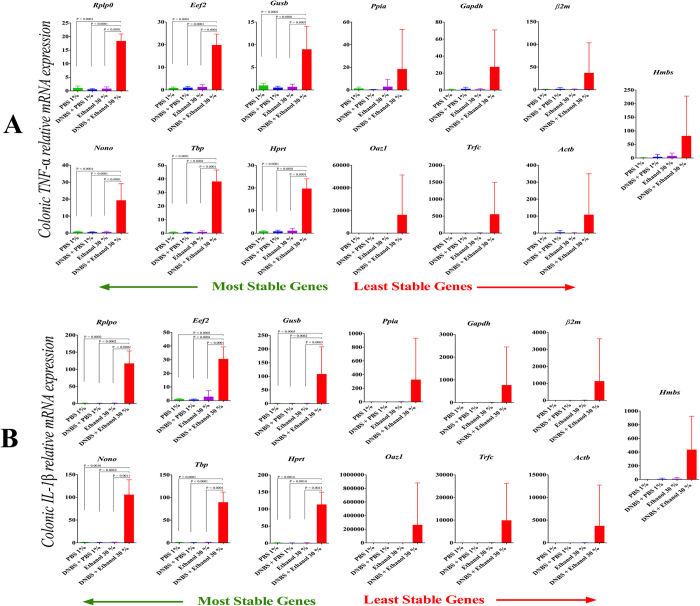
Figure 5.
Effect of reference gene selection on the relative expression of colonic TNF-α (A) and IL-1β (B). Target gene expression was calculated against the 13 reference genes using comparative the ΔΔCt method. Significant changes between control groups (PBS 1%, DNBS + PBS 1%, Ethanol 30%) and DNBS-induced colitis group (DNBS + Ethanol 30%). were seen only with the stable reference genes. One Way ANOVA analysis followed by the multiple comparisons post hoc analysis were used for comparison between the groups. Data is presented as the mean ± SD, (n = 6/group).

