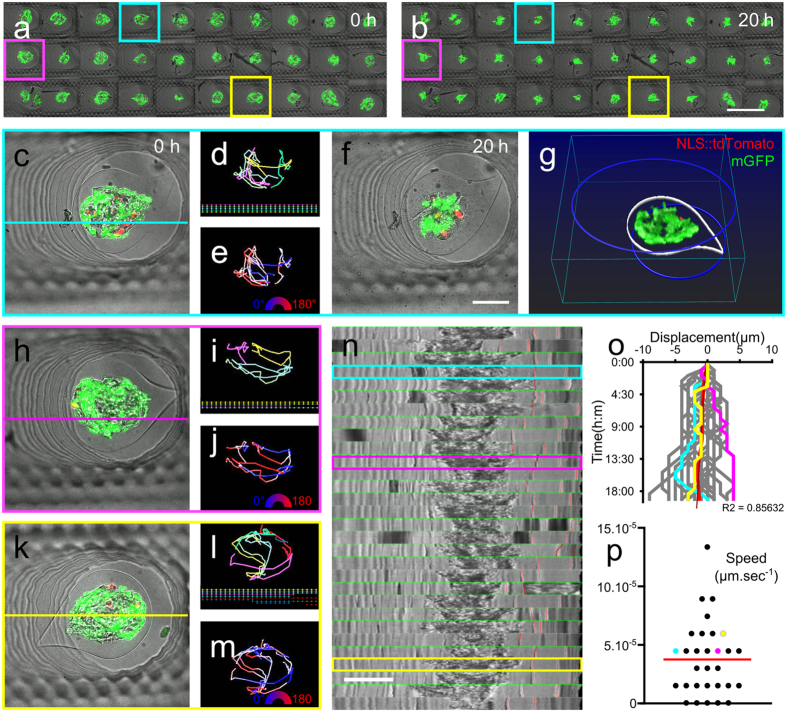
Figure 4. 4D quantification of cells displacement within the capsules, a medium throughput analysis.
(a and b) Tile images of the 30 fields of view imaged overnight with a 40-minute time-step at the beginning of the movie (a) and at the end (b). Field of view #4 (cyan) is exemplified in (c–g), #11 in h-j and #27 in k-m. For each capsule brightfield & fluorescence merge is shown at t0 (c,h and k) [and t + 20 h for #4 (f)]. Tracking of the tdTomato nuclei is represented according to individual cells (d,i and l) or traces are coloured according to directionality (e,j and m). (g) is a 3D rendering of the green and red cells, with the median plane of the capsule outlined (white), and the bottom and top border of the well delineated in blue. Analysis of the capsule motion inside the well is shown in (n–p). (n) Kymograph representation obtained from the bright field images in (c,h and k) by drawing a straight line horizontally in the middle of the field of view. (o) Plot of the displacement of the border of the capsule with respect to the border of the well (distance between thin red lines in n). (p) Scattered plot of the average speed of displacement computed from (o). Bar is 500 μm in (b) and 100 μm (f).

