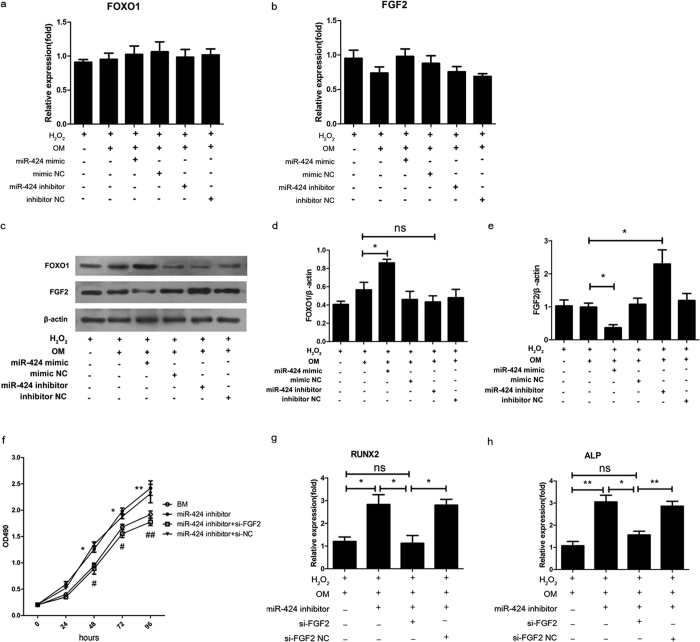
Figure 4. MiR-424 targets FGF2, not FOXO1.
hASCs were transfected with a miR-424 mimic and a miR-424 inhibitor for 24 h. A mimic NC (negative control) and an inhibitor NC were used as a negative control. Thereafter, the cells were incubated with basal medium (BM) or osteogenic medium (OM) and were continuously exposed to H2O2 until the indicated times. (a,b) qRT-PCR shows the mRNA levels of both FOXO1 and FGF2 at 3 days in response to miR-424 overexpression and knockdown. (c,d,e) Western blot was performed to evaluate the protein expression of FOXO1 and FGF2 at 3 days in response to miR-424 overexpression and knockdown. (f) The proliferation of hASCs after cotransfection of a miR-424 inhibitor and FGF2 siRNA was evaluated using a MTS assay. (g,h) The mRNA expression levels of RUNX2 and ALP at 7 days after the cotransfection of a miR-424 inhibitor and FGF2 siRNA were evaluated by qRT-PCR. *P < 0.05, **P < 0.01, #P < 0.05, ##P < 0.01 compared to the miR-424 inhibitor + si-NC group, ns, not significant. The results indicate the mean ± SD of triplicate experiments. The images shown are representative of three independent experiments.

