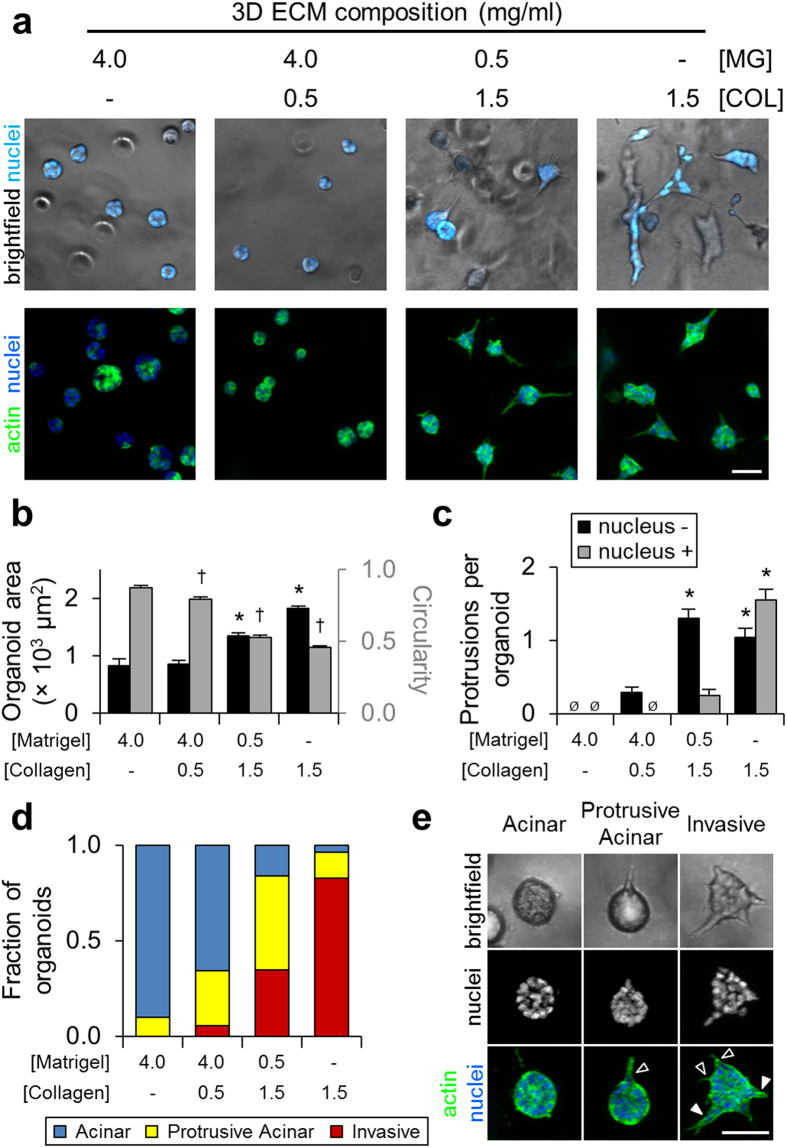
Figure 1. 3D matrix-induced epithelial cell phenotypes.
(a) Brightfield and fluorescent images of MCF-10A epithelial organoids after 4 days of growth in the indicated ECM. (b) Quantification of organoid area (black bars) and circularity (grey bars). *P < 0.001 as compared to Matrigel area; †P < 0.001 as compared to Matrigel circularity. (c) Quantification of nucleus-free (‘nucleus −’, black bars) and nucleus-containing protrusions (‘nucleus +’, grey bars) exhibited by epithelial organoids. Ønone detected. *P < 0.05 as compared to no observed protrusions in Matrigel. Data in (b,c) are mean ± s.e.m. from n > 100 organoids per condition from 3 independent experiments. (d) Quantification of organoid morphology for n > 100 organoids per condition from 3 independent experiments. Circularity was used to determine organoid morphology as described in the text. (e) Representative images of acinar, protrusive acinar, and invasive MCF-10A epithelial organoids. Protrusive acinar and invasive organoids exhibit nucleus-free (black arrowheads) and nucleus-containing (white arrowhead) protrusions. Scale bars: 50 μm.

