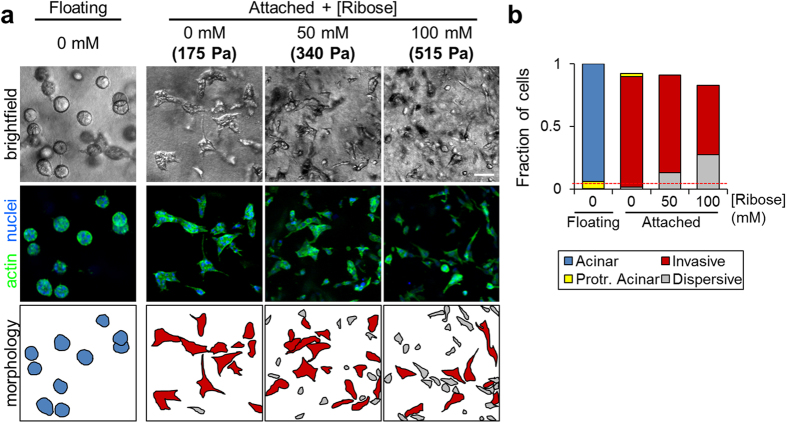
Figure 6. Mechanosensitivity of the invasive epithelial phenotype.
(a) MCF-10A epithelial organoids after 4 days of culture in floating collagen matrix and attached collagen matrix of increasing stiffness. Brightfield, fluorescence, and cartoon representation of cell/organoid morphologies. Cell/organoid cartoon morphologies are color-coded according to legend in (b). Scale bar: 100 μm. (b) Quantification of relative cell density and cell organization as single cells (grey bars) or into multicellular organoids (black bars) for n > 700 cells per condition from 2 independent experiments. Dashed red line indicates initial cell density at seeding.

