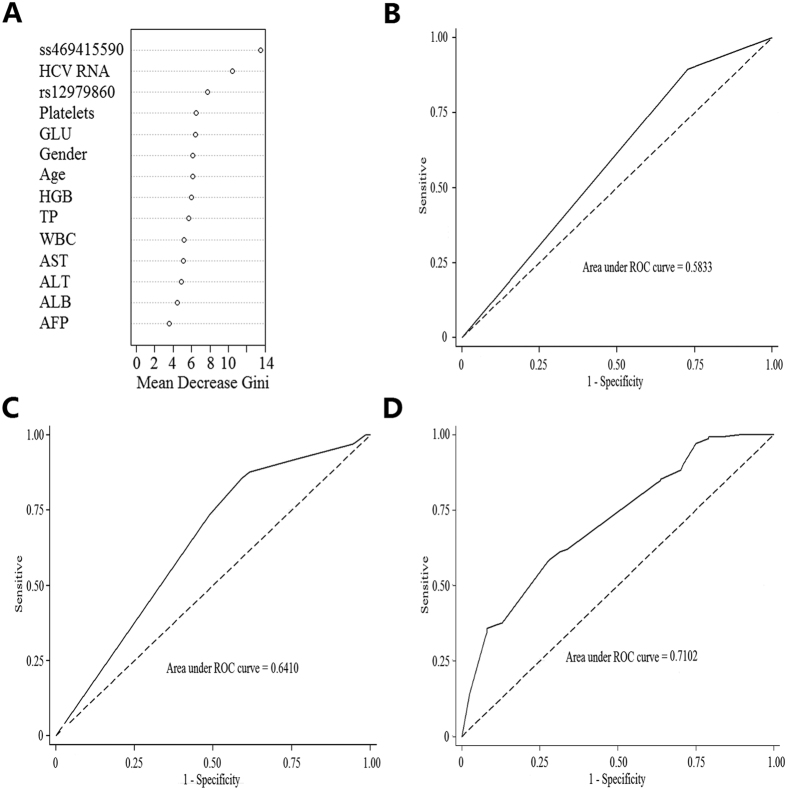
Figure 1. Predictors of HCV treatment response.
(A) Importance blots of all variables in 362 patients. (B) ROC curve for prediction of treatment response using the IFNL4 ss469415590. (C) ROC curve for prediction of treatment response using the combination of IFNL4 ss469415590 and IL28B rs12979860. (D) ROC curve with the combination of IFNL4 ss469415590, IL28B rs12979860, baseline HCV RNA and platelet to predict HCV treatment response.

