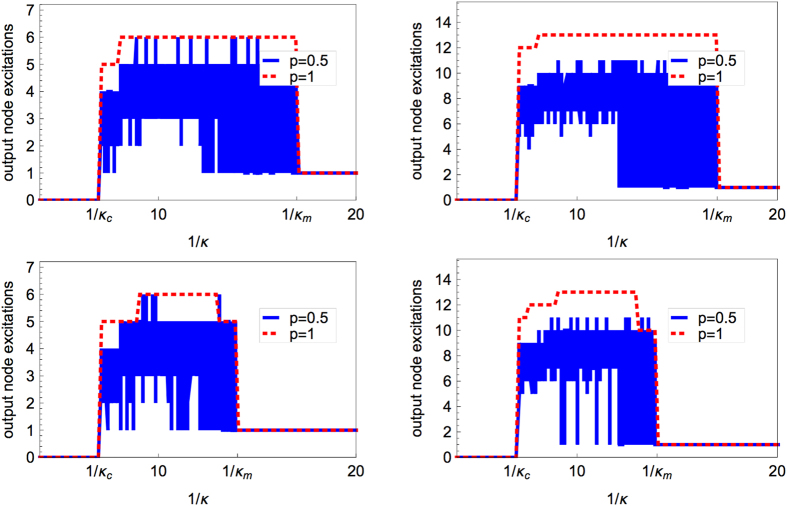
Figure 2. Some examples of response curves for the deterministic (red dashed curve, p = 1) and the stochastic dynamics (blue full curve, p = 0.5, 30 runs, each displayed as a blue full curve) for an ER graph with N = 80, M = 320 in the left column and N = 80, M = 800 in the right column.
For each graph, two randomly chosen input nodes (top and bottom panels) have been considered.

