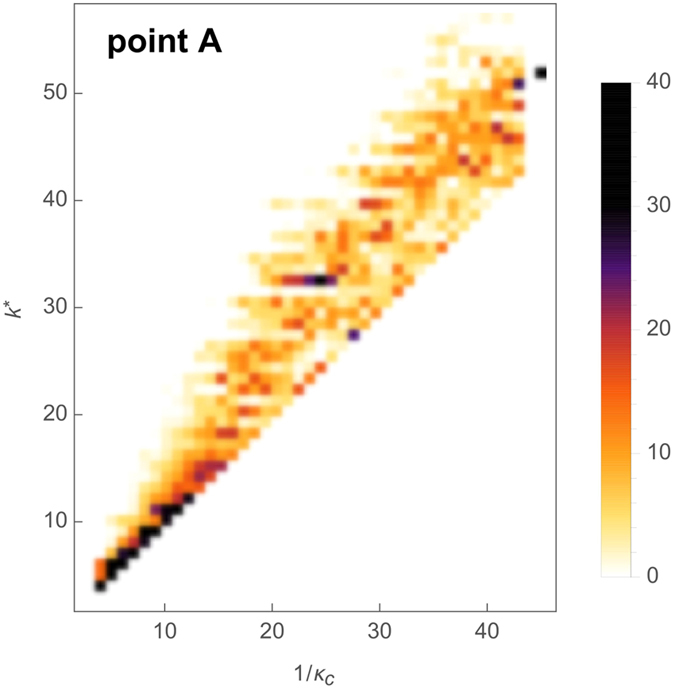
Figure 5. Density histogram of the prediction kmax,1 for the limit of sustained activity (transition point B in Fig. 1) as a function of the observed transition value 1/κm.

This prediction corresponds to the maximal degree in the first layer. Scanning different values of κm is achieved by running the dynamics on networks having N = 80 nodes and M = 100...1900 edges (in steps of 100), considering 10 realizations for each values of M and for each network all the possibilities for the input node, while observing the topological quantity kmax,1. Data are aggregated into a heatmap (color bar on the right, in %) representing the probability density (normalized histogram) of values of kmax,1 for each value of 1/κm.
