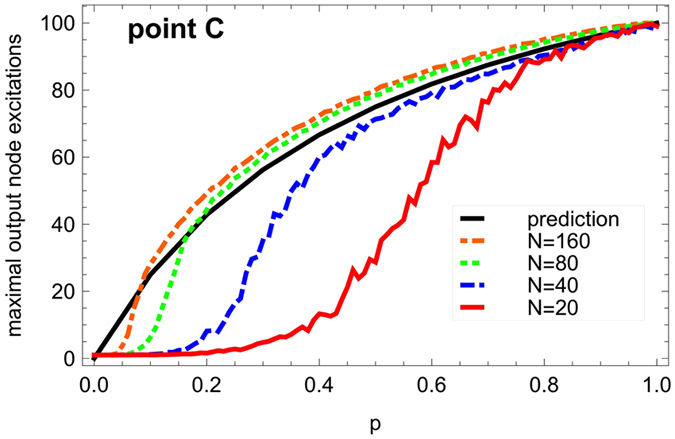
Figure 9. Output excitation saturation level (see.

Fig. 7 for details) as a function of the recovery probability p (steps of Δp = 0.01, 100 runs for each values of p) for dense ER graphs of different sizes N and a large enough number of edges to be located in the saturation plateau in Fig. 7, e.g. M = 640 for N = 80. The black curve displays the prediction amax = 300/(2 + 1/p).
