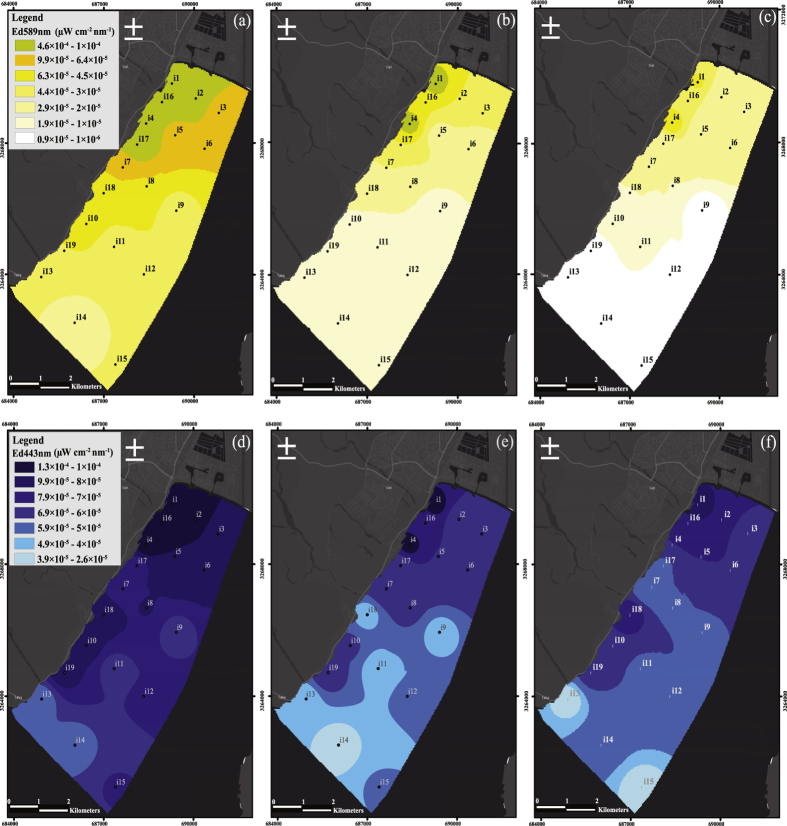
Figure 3.
GIS maps of downwelling irradiance, Ed, sampled in the Gulf of Aqaba at 1-m, 5-m, and 10-m depth in the wavelength channels of yellow light (589 nm; (a–c), respectively) and blue light (443 nm; (d–f), respectively), on the night of August 12th, 2015, at 22:00 local time (GMT + 3). Black/white dots represent sampling locations. The irradiance of yellow light ranged between 1 × 10⁻⁶ (bright yellow) and 4.6 × 10⁻⁴ (bright green) μW cm−2 nm−1. The irradiance of blue light ranged between 2.6 × 10⁻⁵ (bright blue) and 1.3 × 10⁻⁴ (dark blue) μW cm−2 nm−1. (a–f) maps were created by using ArcGIS Version. 10.2.1 (Esri Inc.) platform. Sources: Esri, DeLorme, HERE, USGS, Intermap, iPC, NRCAN, Esri Japan, METI, Esri China (Hong Kong), Esri (Thailand), MapmyIndia, TomTom. Esri, DeLorme, HERE, MapmyIndia).

