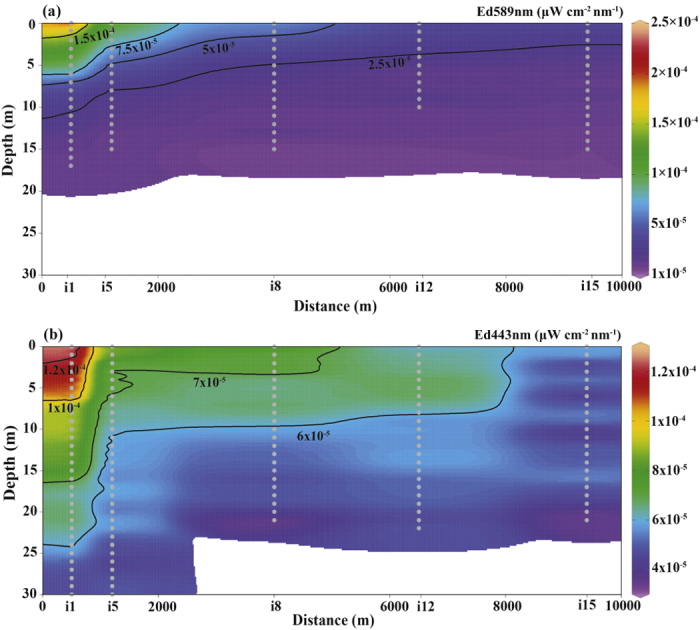
Figure 4.

Vertical cross sectional map (depth versus horizontal distance) of downwelling irradiance (Ed) in the wavelength channels of (a) yellow (589-nm) and (b) blue (443-nm) light, sampled on the night of August 12th, 2015 at 22:00 local time, in the Gulf of Aqaba water column. The map encompasses measurements at stations i1, i5, i8, i12, and i15 (refer to Fig. 2 for station locations). The x-axis represents the distance from the city of Eilat. The uncertainty in the values of irradiance is ±1 × 10⁻⁶ μW cm−2 nm−1. From the surface down to 30 m (the lowest depth at which the instrument was deployed), Ed ranged from 2.5 × 10⁻⁴ to 1 × 10⁻⁶ μW cm−2 nm−1 in the 589-nm (yellow) channel and from 1.2 × 10⁻⁴ to 1 × 10⁻⁶ μW cm−2 nm−1 in the 443-nm (blue) channel. Note that the irradiance of the yellow light reached noise level at a depth of 20 m, while the irradiance of blue light reached noise level at a depth of 22–23 m at stations i8, i12, and i15. The white region of the graphs indicates locations at which the measurements were below the measurement threshold. The measurement locations are shown as gray dots.
