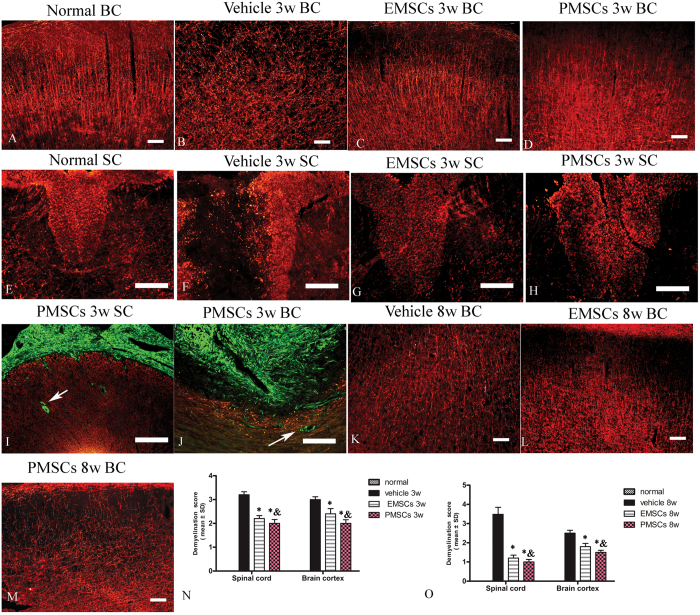
Figure 3. EMSCs and PMECs treatments inhibit demyelination.
(A–J) At 3 weeks post-injection, myelin disruption, disorder and demyelination signs were revealed in the brain cortex and posterior funiculus of spinal cord in vehicle group (showed by MBP immunofluorescence, red), while EMSCs and PMSCs treatments reduced demyelination. In this stage, the transplanted EMSCs and PMSCs (GFP-conjugated, green) in subarachnoid space (I) and lateral ventricles (J) begin to infiltrate into spinal cord and brain tissue parenchymal (showed by arrows). (K–M) At 8 weeks post-injection, the vehicle treated group exhibited more pronounced demyelination and EMSCs and PMSCs treatments obviously reversed this phenomenon. Scale bar = 100 μm. (SC) Transverse sections through the anterior horn of the lumbar spinal. (BC) Coronal sections of the brain cortex. (N,O) The effect of EMSCs and PMSCs treatments on myelination at 3 weeks (N) and 8 weeks (O) post-immunization, as estimated by demyelination score. Data are represented as mean ± SD. n = 5, degrees of freedom = 4. *P < 0.05 Vs vehicle group (3w PI, in SP, EMSCs group: F = 1, P < 0.0001; PMECs group: F = 0.52, P < 0.0001. In BC, EMSCs group: F = 0.28, P = 0.0003; PMECs group: F = 0.63, P < 0.0001. 8 W PI, in SP, EMSCs group: F = 5.33, P P < 0.0001; PMECs group: F = 0.14, P < 0.0001. In BC, EMSCs group: F = 0.2, P < 0.0001; PMECs group: F = 0.55, P < 0.0001) & P < 0.05 Vs EMSCs group (3 W PI, In SP, PMECs group: F = 0.65, P = 0.03. In BC, PMECs group: F = 0.24, P = 0.0044. 8 W PI, In SP, PMECs group: F = 1.39, P = 0.04. In BC, PMECs group: F = 2.18, P = 0.005).

