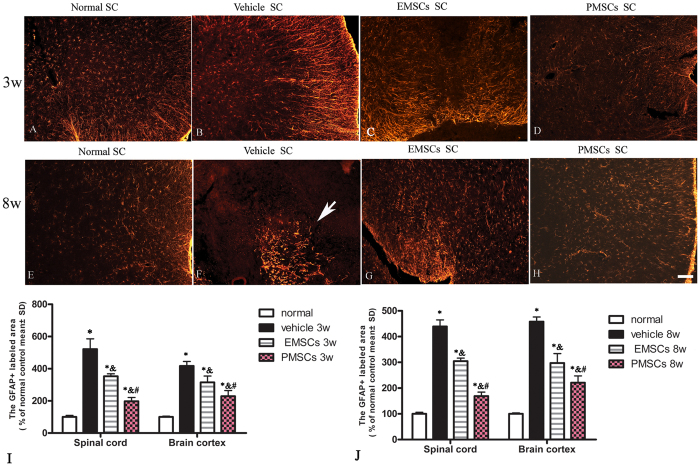
Figure 6. EMSCs and PMSCs treatments alleviated reactive astrocyte proliferation and reactive gliosis in EAE rats.
EMSCs and PMSCs treatments inhibit reactive gliosis in EAE rats (B,F) at both 3 (B–D) and 8 weeks (E–H) post-injection. Arrow in F showed typical gliosis scar. TRIFC-conjugated red immunofluorescence indicate GFAP staining, (SC) Transverse sections through the anterior horn of the lumbar spinal. Scale bar = 100 μm (I–J): Quantification of GFAP+ cells, data are represented as mean ± SD. n = 5, degrees of freedom = 4. *P < 0.01 Vs Normal group (3w PI, in SP, Vehicle group: F = 0.02, P < 0.0001; EMSCs group: F = 0.24, P < 0.0001; PMECs group: F = 0.38, P < 0.0001. In BC, Vehicle group: F = 0.05, P < 0.0001; EMSCs group: F = 0.04, P = 0.0003; PMECs group: F = 0.02, P = 0.0001. 8w PI, in SP, Vehicle group: F = 0.06, P < 0.0001; EMSCs group: F = 0.16, P < 0.0001; PMECs group: F = 0.27, P < 0.0001. In BC, Vehicle group: F = 0.04, P < 0.0001; EMSCs group: F = 0.02, P = 0.0003; PMECs group: F = 0.009, P = 0.0001). &P < 0.01 Vs Vehicle group (3w PI, In SP, EMSCs group: F = 10.65, P < 0.0001; PMECs group: F = 17.06, P = 0.002. In BC, EMSCs group: F = 0.69, P < 0.0001; PMECs group: F = 0.42, P < 0.0001. 8w PI, In SP, EMSCs group: F = 2.85, P < 0.0001; PMECs group: F = 4.81, P < 0.0001. In BC, EMSCs group: F = 0.48, P < 0.0001; PMECs group: F = 0.24, P < 0.0001). #P < 0.05 Vs EMSCs group (3w PI, In SP, PMSCs group: F = 0.62, P < 0.0001; In BC, PMSCs group: F = 0.6, P = 0.005. 8w PI, In SP, PMSCs group: F = 1.69, P < 0.0001; In BC, PMSCs group: F = 1.97, P = 0.003).

